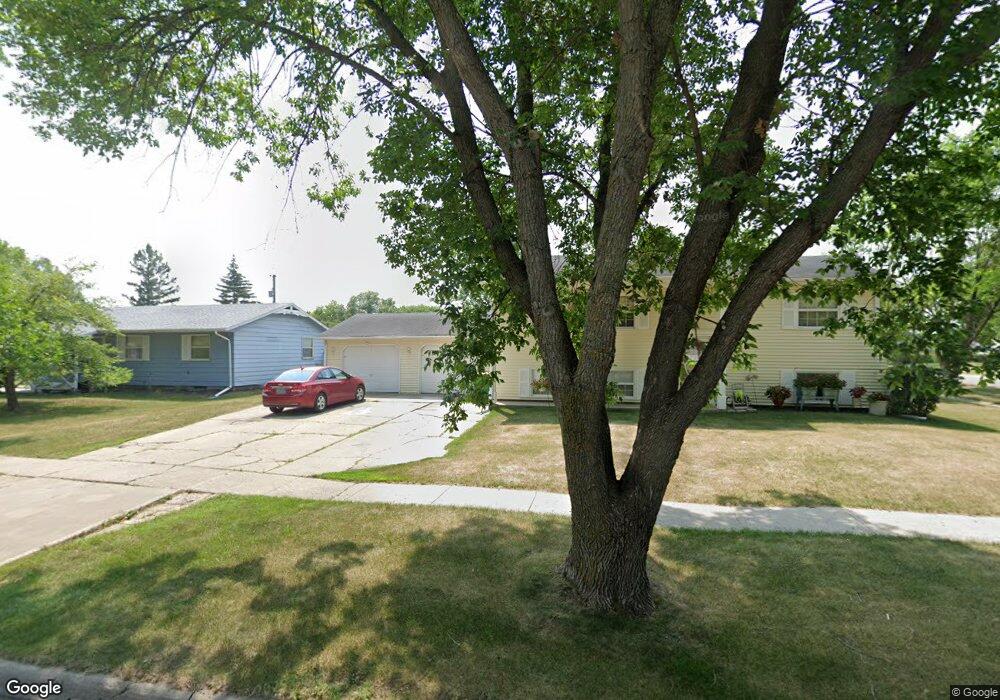
201 10th Ave E West Fargo, ND 58078
Eastwood NeighborhoodEstimated Value: $278,747 - $303,000
4
Beds
2
Baths
2,080
Sq Ft
$140/Sq Ft
Est. Value
About This Home
This home is located at 201 10th Ave E, West Fargo, ND 58078 and is currently estimated at $290,874, approximately $139 per square foot. 201 10th Ave E is a home located in Cass County with nearby schools including Eastwood Elementary School, Cheney Middle School, and West Fargo High School.
Ownership History
Date
Name
Owned For
Owner Type
Purchase Details
Closed on
Nov 30, 2007
Sold by
Krzmarzick Thomas R and Krzmarzick Lynn M
Bought by
Gullingsrud Dean
Current Estimated Value
Home Financials for this Owner
Home Financials are based on the most recent Mortgage that was taken out on this home.
Original Mortgage
$125,400
Outstanding Balance
$76,941
Interest Rate
6.33%
Mortgage Type
New Conventional
Estimated Equity
$213,933
Create a Home Valuation Report for This Property
The Home Valuation Report is an in-depth analysis detailing your home's value as well as a comparison with similar homes in the area
Home Values in the Area
Average Home Value in this Area
Purchase History
We collect this data history from publicly available records. To have your information removed, we recommend requesting removal directly through your county’s website.
| Date | Buyer | Sale Price | Title Company |
|---|---|---|---|
| Gullingsrud Dean | -- | -- |
Source: Public Records
Mortgage History
We collect this data history from publicly available records. To have your information removed, we recommend requesting removal directly through your county’s website.
| Date | Status | Borrower | Loan Amount |
|---|---|---|---|
| Open | Gullingsrud Dean | $125,400 |
Source: Public Records
Tax History
| Year | Tax Paid | Tax Assessment Tax Assessment Total Assessment is a certain percentage of the fair market value that is determined by local assessors to be the total taxable value of land and additions on the property. | Land | Improvement |
|---|---|---|---|---|
| 2025 | $2,252 | $134,800 | $29,900 | $104,900 |
| 2024 | $2,932 | $126,200 | $25,300 | $100,900 |
| 2023 | $3,346 | $122,350 | $25,300 | $97,050 |
| 2022 | $3,221 | $112,400 | $25,300 | $87,100 |
| 2021 | $2,965 | $99,600 | $18,400 | $81,200 |
| 2020 | $2,899 | $100,700 | $18,400 | $82,300 |
| 2019 | $2,760 | $97,550 | $18,400 | $79,150 |
| 2018 | $2,703 | $100,150 | $18,400 | $81,750 |
| 2017 | $2,545 | $97,050 | $18,400 | $78,650 |
| 2016 | $2,239 | $93,900 | $18,400 | $75,500 |
| 2015 | $1,835 | $70,450 | $15,300 | $55,150 |
| 2014 | $1,796 | $65,850 | $15,300 | $50,550 |
| 2013 | $1,828 | $65,850 | $15,300 | $50,550 |
Source: Public Records
Map
Nearby Homes
- 302 10th Ave E
- 205 12th Ave E
- 208 10 1/2 Ave W
- 239 12 1 2 Ave E
- 101 7th Ave E
- 307 12th Ave E
- 226 10 1/2 Ave W
- 237 10 1/2 Ave W
- 906 Sheyenne St
- 602 12 1 2 Ave E Unit 5
- 622 12th Ave E
- 706 14th Ave E
- 719 10th Ave E
- 649 7th Ave E
- 402 Morrison St
- 201 Sukuts St
- 202 5th St E
- 901 7th St W
- 214 Morrison St
- 806 7th St W
Your Personal Tour Guide
Ask me questions while you tour the home.