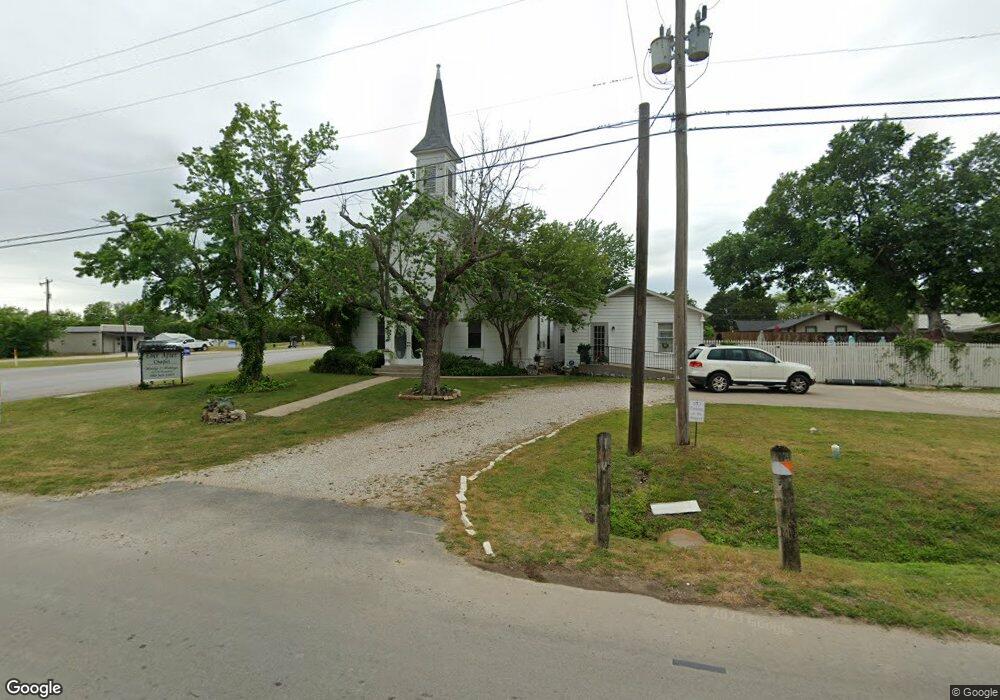
201 N Main St Aubrey, TX 76227
Estimated Value: $314,000 - $516,381
2
Beds
1
Bath
5,156
Sq Ft
$77/Sq Ft
Est. Value
About This Home
This home is located at 201 N Main St, Aubrey, TX 76227 and is currently estimated at $399,460, approximately $77 per square foot. 201 N Main St is a home with nearby schools including HL Brockett Elementary School, Owens Middle School, and Aubrey High School.
Ownership History
Date
Name
Owned For
Owner Type
Purchase Details
Closed on
Feb 23, 1998
Sold by
The First Baptist Church Of Aubrey
Bought by
Ledane Holly and Ledane Gregory S
Current Estimated Value
Home Financials for this Owner
Home Financials are based on the most recent Mortgage that was taken out on this home.
Original Mortgage
$90,800
Outstanding Balance
$15,439
Interest Rate
6.91%
Mortgage Type
Commercial
Estimated Equity
$384,021
Create a Home Valuation Report for This Property
The Home Valuation Report is an in-depth analysis detailing your home's value as well as a comparison with similar homes in the area
Home Values in the Area
Average Home Value in this Area
Purchase History
| Date | Buyer | Sale Price | Title Company |
|---|---|---|---|
| Ledane Holly | -- | -- | |
| Ledane Holly | -- | -- |
Source: Public Records
Mortgage History
| Date | Status | Borrower | Loan Amount |
|---|---|---|---|
| Open | Ledane Holly | $90,800 | |
| Closed | Ledane Holly | $90,800 |
Source: Public Records
Tax History
| Year | Tax Paid | Tax Assessment Tax Assessment Total Assessment is a certain percentage of the fair market value that is determined by local assessors to be the total taxable value of land and additions on the property. | Land | Improvement |
|---|---|---|---|---|
| 2025 | $11,703 | $554,546 | $177,725 | $376,821 |
| 2024 | $11,703 | $613,657 | $177,725 | $435,932 |
| 2023 | $11,899 | $622,641 | $177,725 | $444,916 |
| 2022 | $12,214 | $574,671 | $44,431 | $530,240 |
| 2021 | $11,157 | $490,379 | $44,431 | $445,948 |
| 2020 | $9,401 | $402,564 | $44,431 | $358,133 |
| 2019 | $5,941 | $252,008 | $44,431 | $207,577 |
| 2018 | $5,435 | $237,341 | $44,431 | $192,910 |
| 2017 | $5,768 | $248,578 | $44,431 | $204,147 |
| 2016 | $6,090 | $262,454 | $44,431 | $218,023 |
| 2015 | -- | $267,762 | $44,431 | $223,331 |
| 2013 | -- | $276,848 | $44,431 | $232,417 |
Source: Public Records
Map
Nearby Homes
- 7213 Cherry Blossom Ln
- 309 W Sherman Dr
- TBD E North St
- 504 Hill St
- 506 N Main St
- 502 S Main St Unit B
- 503 Caddell St
- 604 N Cherry St
- 506 Caddell St
- 511 W Pecan St
- 4004 Horsemint Rd
- TBD Farm To Market Road 428
- TBD Rock Hill Rd
- 504 Bluebonnet St
- 506 Bluebonnet St
- 217 Quail Run
- 600 Arabian Ln
- 2212 Pommel Ln
- 604 Arabian Ln
- 2220 Pommel Ln
- 202 N Cherry St
- 100 S Main St Unit S
- 146 W Sherman Dr
- 146 W Sherman Dr Unit 1
- 204 N Cherry St
- 7 W Sherman Dr
- 207 N Main St
- 200 N Main St
- 1729 Fm 428 Dr
- x Fm 428 Rd
- 4760 377 Hwy
- tbd Ranch Estates
- 2015 Sulky Ln
- 105 Fm 428
- 101 E Elm St
- 114 James St
- 102 James St
- 301 N Main St
- 300 N Cherry St
- 110 N Sherman Dr
Your Personal Tour Guide
Ask me questions while you tour the home.