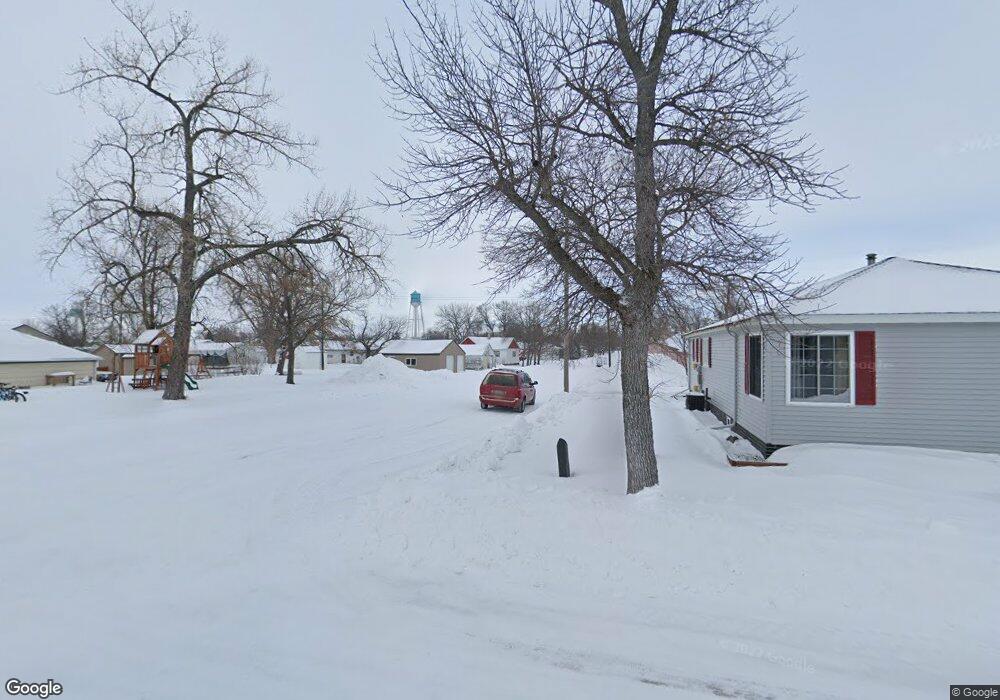
201 S 3rd St Wishek, ND 58495
Estimated Value: $111,000 - $194,000
Studio
--
Bath
--
Sq Ft
--
Built
About This Home
This home is located at 201 S 3rd St, Wishek, ND 58495 and is currently estimated at $136,712. 201 S 3rd St is a home located in McIntosh County with nearby schools including Wishek Elementary School and Wishek High School.
Ownership History
Date
Name
Owned For
Owner Type
Purchase Details
Closed on
Mar 11, 2022
Sold by
Horner James A and Horner Kelsey
Bought by
Smith Sloan T
Current Estimated Value
Home Financials for this Owner
Home Financials are based on the most recent Mortgage that was taken out on this home.
Original Mortgage
$76,145
Outstanding Balance
$70,722
Interest Rate
4.17%
Mortgage Type
Construction
Estimated Equity
$65,990
Purchase Details
Closed on
Oct 5, 2016
Sold by
Wanner Kelly K
Bought by
Horner James A
Home Financials for this Owner
Home Financials are based on the most recent Mortgage that was taken out on this home.
Original Mortgage
$74,035
Interest Rate
3.43%
Mortgage Type
New Conventional
Create a Home Valuation Report for This Property
The Home Valuation Report is an in-depth analysis detailing your home's value as well as a comparison with similar homes in the area
Purchase History
| Date | Buyer | Sale Price | Title Company |
|---|---|---|---|
| Smith Sloan T | $78,500 | North Dakota Guaranty & Title | |
| Horner James A | $72,000 | -- |
Source: Public Records
Mortgage History
| Date | Status | Borrower | Loan Amount |
|---|---|---|---|
| Open | Smith Sloan T | $76,145 | |
| Previous Owner | Horner James A | $74,035 |
Source: Public Records
Tax History
| Year | Tax Paid | Tax Assessment Tax Assessment Total Assessment is a certain percentage of the fair market value that is determined by local assessors to be the total taxable value of land and additions on the property. | Land | Improvement |
|---|---|---|---|---|
| 2025 | $1,707 | $50,500 | $3,000 | $47,500 |
| 2024 | $1,442 | $42,400 | $3,000 | $39,400 |
| 2023 | $1,365 | $41,350 | $3,000 | $38,350 |
| 2022 | $1,294 | $40,600 | $2,950 | $37,650 |
| 2021 | $1,162 | $36,000 | $2,800 | $33,200 |
| 2020 | $1,156 | $36,000 | $2,800 | $33,200 |
| 2019 | $790 | $24,073 | $1,101 | $22,972 |
| 2018 | $691 | $24,073 | $1,101 | $22,972 |
| 2017 | $551 | $37,071 | $2,048 | $35,023 |
| 2016 | $526 | $36,051 | $2,048 | $34,003 |
| 2015 | $479 | $0 | $0 | $0 |
| 2014 | $467 | $0 | $0 | $0 |
| 2013 | $447 | $0 | $0 | $0 |
Source: Public Records
Map
Nearby Homes
Your Personal Tour Guide
Ask me questions while you tour the home.