2011 Henley St Glenview, IL 60025
Estimated Value: $1,525,000 - $1,696,000
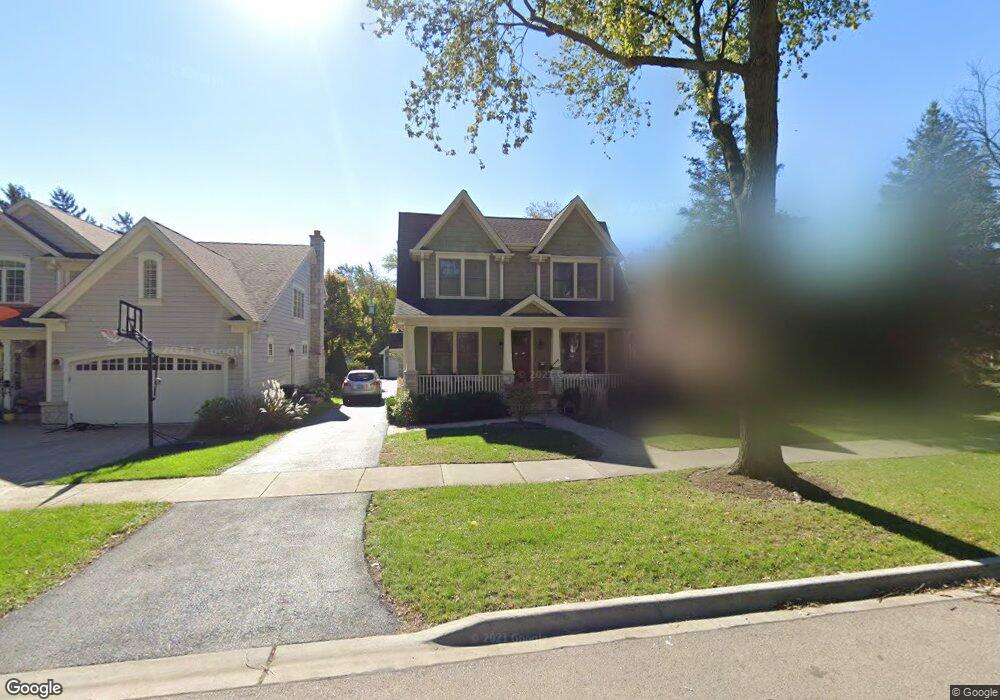
About This Home
This home is located at 2011 Henley St, Glenview, IL 60025 and is currently estimated at $1,602,591, approximately $520 per square foot. 2011 Henley St is a home located in Cook County with nearby schools including Hoffman Elementary School, Henking Elementary School, and Springman Middle School.
Ownership History
We collect this data history from publicly available records. To have your information removed, we recommend requesting removal directly through your county’s website.
Purchase Details
Home Financials for this Owner
Home Financials are based on the most recent Mortgage that was taken out on this home.Purchase Details
Home Values in the Area
Average Home Value in this Area
Purchase History
We collect this data history from publicly available records. To have your information removed, we recommend requesting removal directly through your county’s website.
| Date | Buyer | Sale Price | Title Company |
|---|---|---|---|
| $1,092,500 | Cti | ||
| $435,000 | Attorneys Title Guaranty Fun |
Mortgage History
We collect this data history from publicly available records. To have your information removed, we recommend requesting removal directly through your county’s website.
| Date | Status | Borrower | Loan Amount |
|---|---|---|---|
| Open | $819,375 |
Tax History
We collect this data history from publicly available records. To have your information removed, we recommend requesting removal directly through your county’s website.
| Year | Tax Paid | Tax Assessment Tax Assessment Total Assessment is a certain percentage of the fair market value that is determined by local assessors to be the total taxable value of land and additions on the property. | Land | Improvement |
|---|---|---|---|---|
| 2025 | $20,431 | $138,000 | $17,771 | $120,229 |
| 2024 | $20,431 | $95,626 | $14,965 | $80,661 |
| 2023 | $24,430 | $95,626 | $14,965 | $80,661 |
| 2022 | $24,430 | $117,000 | $14,965 | $102,035 |
| 2021 | $17,858 | $75,080 | $11,457 | $63,623 |
| 2020 | $18,877 | $79,855 | $11,457 | $68,398 |
| 2019 | $18,737 | $93,258 | $11,457 | $81,801 |
| 2018 | $16,403 | $74,755 | $10,054 | $64,701 |
| 2017 | $15,979 | $74,755 | $10,054 | $64,701 |
| 2016 | $15,285 | $74,755 | $10,054 | $64,701 |
| 2015 | $14,054 | $61,638 | $8,183 | $53,455 |
| 2014 | $14,501 | $64,596 | $8,183 | $56,413 |
| 2013 | $15,511 | $71,066 | $8,183 | $62,883 |
Map
- 1942 Palmgren Dr
- 1803 Henley St Unit A
- 1777 Dewes St Unit F
- 1800 Dewes St Unit 204
- 1909 Central Rd
- 2226 Central Rd
- 2387 Larkdale Dr
- 2238 Prairie St
- 1026 Church St
- 517 Briarhill Ln
- 2232 Covert Rd
- 706 Waukegan Rd Unit C203
- 706 Waukegan Rd Unit 206-C
- 702 Waukegan Rd Unit 206A
- 1810 Culver Ln
- 440 Briarhill Rd
- 2142 Harrison St
- 609 Carriage Hill Dr
- 1534 Palmgren Dr
- 2005 Henley St
- 2015 Henley St
- 2001 Henley St
- 2017 Henley St
- 2023 Henley St
- 2010 Linneman St
- 2006 Linneman St
- 2014 Linneman St
- 2000 Linneman St
- 2018 Linneman St
- 1965 Henley St
- 2027 Henley St
- 2022 Linneman St
- 2010 Henley St
- 2006 Henley St
- 2014 Henley St
- 1961 Henley St
- 2000 Henley St
- 2016 Henley St
- 2028 Linneman St
Ask me questions while you tour the home.