Estimated Value: $318,000 - $449,429
5
Beds
3
Baths
3,360
Sq Ft
$122/Sq Ft
Est. Value
About This Home
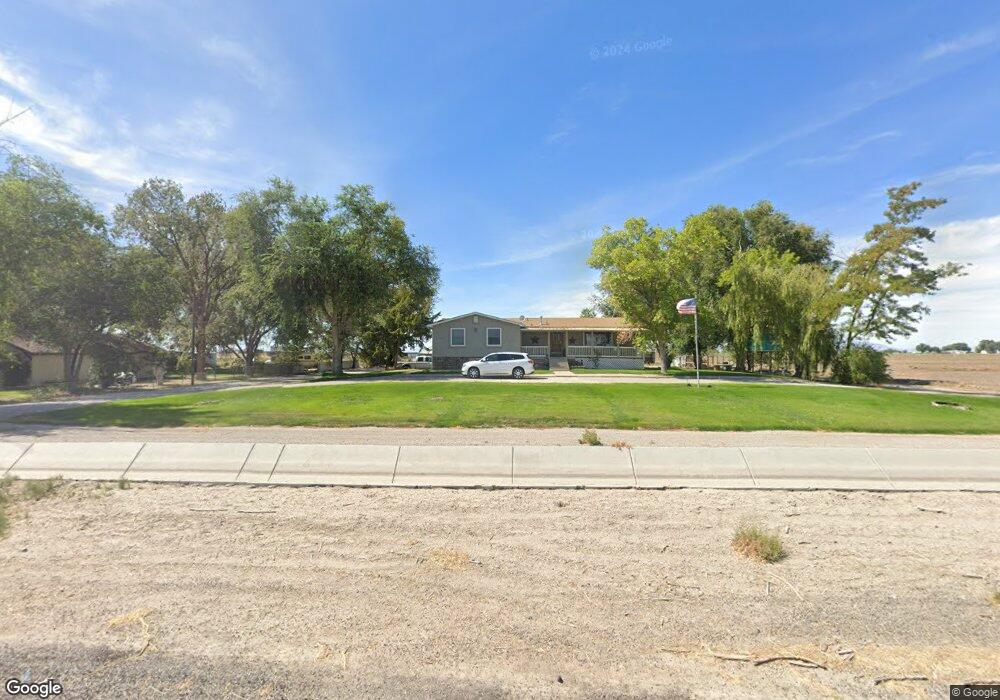
This home is located at 2015 N 3000 W, Delta, UT 84624 and is currently estimated at $408,607, approximately $121 per square foot. 2015 N 3000 W is a home located in Millard County.
Ownership History
Date
Name
Owned For
Owner Type
Purchase Details
Closed on
Mar 18, 2019
Sold by
Boyden Corey and Boyden Cara
Bought by
Boyden Cara L and Boyden Corey
Current Estimated Value
Purchase Details
Closed on
May 3, 2016
Sold by
Oppenheimer Robert Kelly and Oppenheimer Shari T
Bought by
Boyden Corey and Boyden Cara
Home Financials for this Owner
Home Financials are based on the most recent Mortgage that was taken out on this home.
Original Mortgage
$202,500
Outstanding Balance
$159,957
Interest Rate
3.59%
Mortgage Type
New Conventional
Estimated Equity
$248,650
Create a Home Valuation Report for This Property
The Home Valuation Report is an in-depth analysis detailing your home's value as well as a comparison with similar homes in the area
Purchase History
| Date | Buyer | Sale Price | Title Company |
|---|---|---|---|
| Boyden Cara L | -- | -- | |
| Boyden Corey | -- | First American Title |
Source: Public Records
Mortgage History
| Date | Status | Borrower | Loan Amount |
|---|---|---|---|
| Open | Boyden Corey | $202,500 |
Source: Public Records
Tax History
| Year | Tax Paid | Tax Assessment Tax Assessment Total Assessment is a certain percentage of the fair market value that is determined by local assessors to be the total taxable value of land and additions on the property. | Land | Improvement |
|---|---|---|---|---|
| 2025 | $1,849 | $227,806 | $19,750 | $208,056 |
| 2024 | $1,849 | $235,736 | $14,250 | $221,486 |
| 2023 | $2,090 | $235,736 | $14,250 | $221,486 |
| 2022 | $1,745 | $154,648 | $12,650 | $141,998 |
| 2021 | $1,375 | $117,566 | $12,650 | $104,916 |
| 2020 | $1,318 | $113,496 | $12,650 | $100,846 |
| 2019 | $1,269 | $110,331 | $12,650 | $97,681 |
| 2018 | $1,107 | $98,676 | $12,650 | $86,026 |
| 2017 | $1,118 | $95,376 | $9,350 | $86,026 |
| 2016 | $923 | $82,465 | $9,350 | $73,115 |
| 2015 | $923 | $82,465 | $9,350 | $73,115 |
| 2014 | -- | $82,465 | $9,350 | $73,115 |
| 2013 | -- | $77,095 | $9,350 | $67,745 |
Source: Public Records
Map
Nearby Homes
Your Personal Tour Guide
Ask me questions while you tour the home.