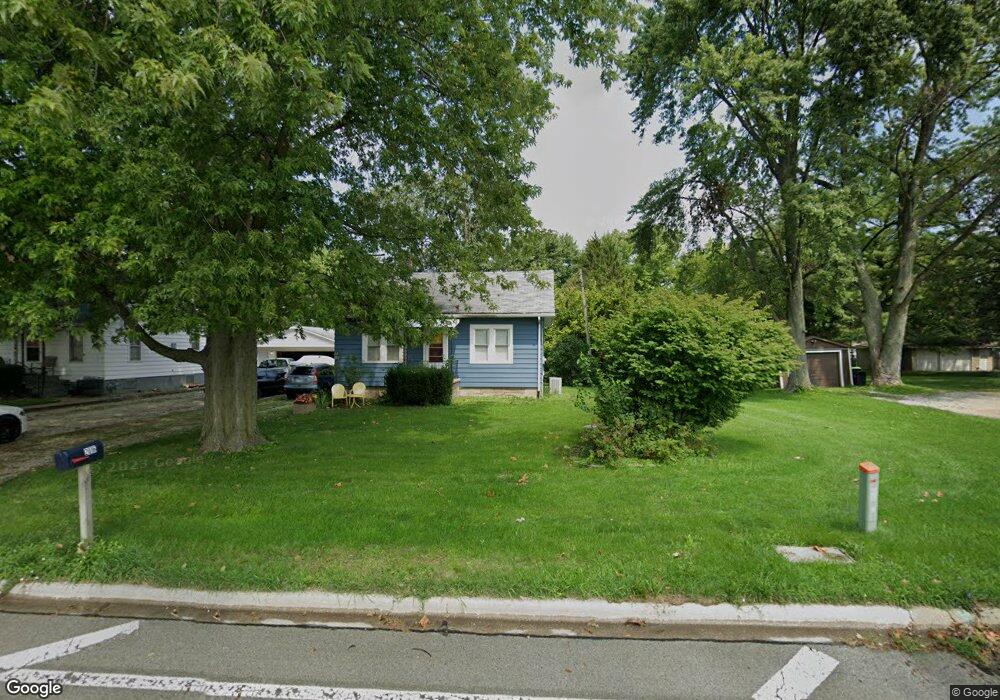
2016 E Main St Urbana, IL 61802
East Urbana NeighborhoodEstimated Value: $107,000 - $152,000
Studio
1
Bath
720
Sq Ft
$166/Sq Ft
Est. Value
About This Home
This home is located at 2016 E Main St, Urbana, IL 61802 and is currently estimated at $119,848, approximately $166 per square foot. 2016 E Main St is a home located in Champaign County with nearby schools including Dr. Preston L. Williams Jr. Elementary School, Urbana Middle School, and Urbana High School.
Ownership History
Date
Name
Owned For
Owner Type
Purchase Details
Closed on
Nov 20, 2015
Sold by
Odom Michael L
Bought by
Yoos Paul F and Yoos Y
Current Estimated Value
Home Financials for this Owner
Home Financials are based on the most recent Mortgage that was taken out on this home.
Original Mortgage
$85,470
Outstanding Balance
$66,552
Interest Rate
3.74%
Mortgage Type
New Conventional
Estimated Equity
$53,296
Purchase Details
Closed on
Sep 22, 2004
Sold by
Dosey Virginia Lee and Bothfuhr Michael A
Bought by
Brenner Timothy L and Brenner Donna M J
Home Financials for this Owner
Home Financials are based on the most recent Mortgage that was taken out on this home.
Original Mortgage
$52,800
Interest Rate
5.32%
Mortgage Type
Purchase Money Mortgage
Purchase Details
Closed on
Feb 4, 2004
Sold by
Dosey Virginia Lee
Bought by
Dosey Virginia Lee and Bothfuhr Michael A
Create a Home Valuation Report for This Property
The Home Valuation Report is an in-depth analysis detailing your home's value as well as a comparison with similar homes in the area
Home Values in the Area
Average Home Value in this Area
Purchase History
| Date | Buyer | Sale Price | Title Company |
|---|---|---|---|
| Yoos Paul F | -- | -- | |
| Brenner Timothy L | $66,000 | -- | |
| Dosey Virginia Lee | -- | -- |
Source: Public Records
Mortgage History
| Date | Status | Borrower | Loan Amount |
|---|---|---|---|
| Open | Yoos Paul F | $85,470 | |
| Previous Owner | Brenner Timothy L | $52,800 |
Source: Public Records
Tax History
| Year | Tax Paid | Tax Assessment Tax Assessment Total Assessment is a certain percentage of the fair market value that is determined by local assessors to be the total taxable value of land and additions on the property. | Land | Improvement |
|---|---|---|---|---|
| 2024 | $2,538 | $30,530 | $7,010 | $23,520 |
| 2023 | $2,333 | $27,860 | $6,400 | $21,460 |
| 2022 | $2,135 | $25,650 | $5,890 | $19,760 |
| 2021 | $1,939 | $23,910 | $5,490 | $18,420 |
| 2020 | $1,858 | $23,210 | $5,330 | $17,880 |
| 2019 | $1,808 | $23,210 | $5,330 | $17,880 |
| 2018 | $1,803 | $23,380 | $5,370 | $18,010 |
| 2017 | $1,865 | $23,380 | $5,370 | $18,010 |
| 2016 | $1,759 | $22,480 | $5,160 | $17,320 |
| 2015 | $1,771 | $22,480 | $5,160 | $17,320 |
| 2014 | $1,747 | $22,480 | $5,160 | $17,320 |
| 2013 | $1,724 | $22,480 | $5,160 | $17,320 |
Source: Public Records
Map
Nearby Homes
- 205 Carrie Ave
- 2308 Slayback St
- 128 S Scottswood Dr
- 414 S Dodson Dr
- 238 Dewey St
- 901 S Country Squire Dr
- 506 S Sunny Ln
- 1005 S Country Squire Dr
- 709 N Abbey Rd
- 1616 Hunter St
- 2310 E Country Squire Dr
- 2804 Haydon Dr
- 607 S Glover Ave
- 1303 Greenridge Dr
- 1305 S Smith Rd
- 1307 S Smith Rd
- 1112 Lanore Dr
- 1304 Ogelthorpe Ave
- 1311 S Smith Rd
- 2802 Haydon Dr
- 2014 E Main St
- 2104 E Main St
- 2012 E Main St
- 2106 E Main St
- 2006 E Main St
- 2108 E Main St
- 2110 E Main St
- 2004 E Main St
- 2002 E Main St
- 2202 E Main St
- 1912 E Main St
- 2204 E Main St
- 2206 E Main St
- 2204 E University Ave
- 1908 E Main St
- 2208 E Main St
- 107 N Smith Rd
- 2218 E University Ave
- 2302 E Main St
- 108 N Smith Rd
Your Personal Tour Guide
Ask me questions while you tour the home.