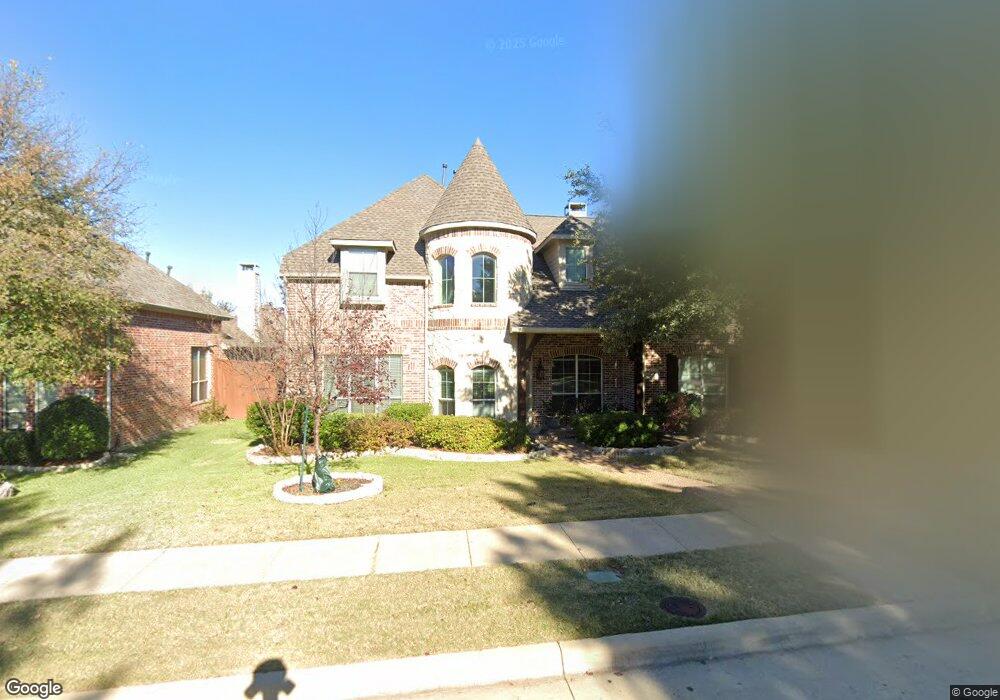
2018 Burnside Dr Allen, TX 75013
Twin Creeks NeighborhoodEstimated Value: $778,760 - $823,000
5
Beds
4
Baths
4,308
Sq Ft
$185/Sq Ft
Est. Value
About This Home
This home is located at 2018 Burnside Dr, Allen, TX 75013 and is currently estimated at $798,690, approximately $185 per square foot. 2018 Burnside Dr is a home located in Collin County with nearby schools including Mary Evans Elementary School, Ereckson Middle School, and Lowery Freshman Center.
Ownership History
Date
Name
Owned For
Owner Type
Purchase Details
Closed on
Dec 22, 2003
Sold by
Shaddock Builders & Developers Inc
Bought by
Perlman Larry Alan and Perlman Carol
Current Estimated Value
Home Financials for this Owner
Home Financials are based on the most recent Mortgage that was taken out on this home.
Original Mortgage
$283,500
Outstanding Balance
$132,652
Interest Rate
6.02%
Mortgage Type
Purchase Money Mortgage
Estimated Equity
$666,038
Create a Home Valuation Report for This Property
The Home Valuation Report is an in-depth analysis detailing your home's value as well as a comparison with similar homes in the area
Home Values in the Area
Average Home Value in this Area
Purchase History
| Date | Buyer | Sale Price | Title Company |
|---|---|---|---|
| Perlman Larry Alan | -- | -- |
Source: Public Records
Mortgage History
| Date | Status | Borrower | Loan Amount |
|---|---|---|---|
| Open | Perlman Larry Alan | $283,500 |
Source: Public Records
Tax History
| Year | Tax Paid | Tax Assessment Tax Assessment Total Assessment is a certain percentage of the fair market value that is determined by local assessors to be the total taxable value of land and additions on the property. | Land | Improvement |
|---|---|---|---|---|
| 2025 | $8,409 | $727,727 | $180,000 | $547,727 |
| 2024 | $13,503 | $673,808 | $180,000 | $581,192 |
| 2023 | $13,503 | $612,553 | $150,000 | $632,502 |
| 2022 | $11,055 | $556,866 | $125,000 | $505,411 |
| 2021 | $10,763 | $506,242 | $105,000 | $401,242 |
| 2020 | $10,835 | $491,589 | $95,000 | $396,589 |
| 2019 | $10,774 | $466,385 | $95,000 | $371,385 |
| 2018 | $10,806 | $459,443 | $95,000 | $364,443 |
| 2017 | $10,522 | $447,370 | $95,000 | $352,370 |
| 2016 | $10,313 | $429,786 | $85,000 | $344,786 |
| 2015 | $8,697 | $398,560 | $75,000 | $323,560 |
Source: Public Records
Map
Nearby Homes
- 2015 Midhurst Dr
- 622 Naples Dr
- 2028 Artemis Ct
- 1909 Rising Star Dr
- 1913 Esparanza Ct
- 804 Kimball Ct
- 2400 Geiberger Dr
- 262 Driscoll St
- 216 Moss Haven Place
- 217 Driscoll St
- 213 Moss Haven Place
- 504 Bristol Dr
- 254 Driscoll St
- 1863 Audubon Pond Way
- 206 Kings Hollow Place
- 205 Hunters Glen Way
- 204 Hunters Glen Way
- 9104 Blue Water Dr
- 205 Ardsley Way
- 204 Kings Hollow Place
- 2016 Burnside Dr
- 2020 Burnside Dr
- 2014 Burnside Dr
- 2022 Burnside Dr
- 2019 Huntcliffe Ct
- 2017 Huntcliffe Ct
- 2021 Huntcliffe Ct
- 2019 Burnside Dr
- 2017 Burnside Dr
- 2015 Huntcliffe Ct
- 2021 Burnside Dr
- 2012 Burnside Dr
- 2024 Burnside Dr
- 2023 Huntcliffe Ct
- 2015 Burnside Dr
- 2023 Burnside Dr
- 2013 Huntcliffe Ct
- 2013 Burnside Dr
- 2025 Huntcliffe Ct
- 2025 Burnside Dr
Your Personal Tour Guide
Ask me questions while you tour the home.