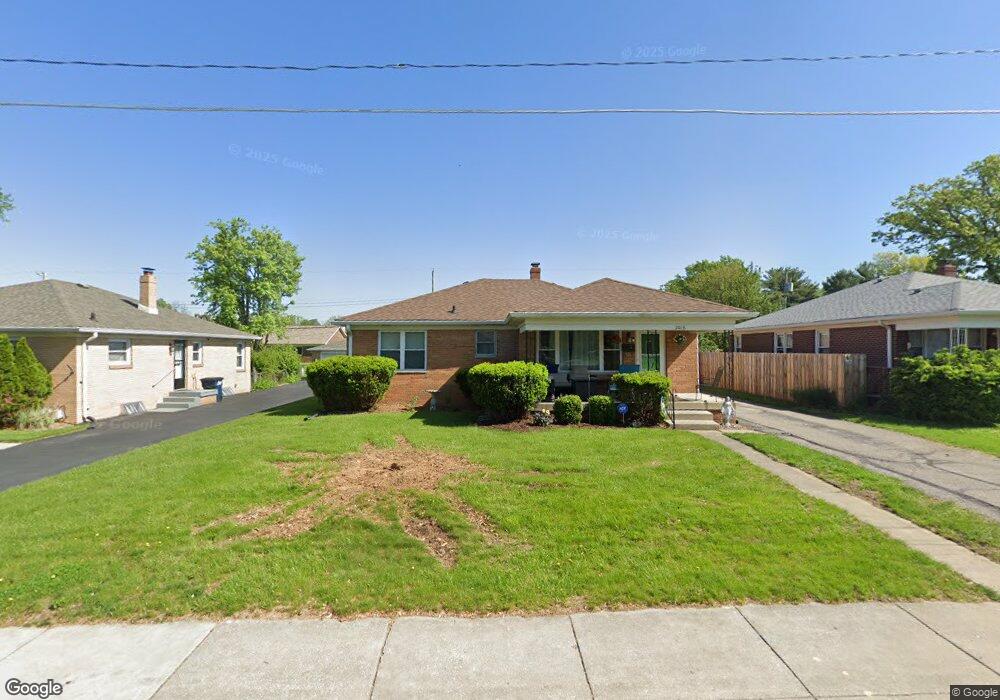
2018 Main St Beech Grove, IN 46107
Estimated Value: $190,000 - $223,299
3
Beds
2
Baths
2,680
Sq Ft
$77/Sq Ft
Est. Value
About This Home
This home is located at 2018 Main St, Beech Grove, IN 46107 and is currently estimated at $207,325, approximately $77 per square foot. 2018 Main St is a home located in Marion County with nearby schools including Hornet Park Elementary School, Central Elementary School, and South Grove Intermediate School.
Ownership History
Date
Name
Owned For
Owner Type
Purchase Details
Closed on
Dec 27, 2011
Sold by
Keyler Carole Ann and Keyler Carol Ann
Bought by
Gallagher Timothy M and Gallagher Carol M
Current Estimated Value
Home Financials for this Owner
Home Financials are based on the most recent Mortgage that was taken out on this home.
Original Mortgage
$74,100
Outstanding Balance
$5,375
Interest Rate
3.98%
Mortgage Type
New Conventional
Estimated Equity
$201,950
Create a Home Valuation Report for This Property
The Home Valuation Report is an in-depth analysis detailing your home's value as well as a comparison with similar homes in the area
Home Values in the Area
Average Home Value in this Area
Purchase History
| Date | Buyer | Sale Price | Title Company |
|---|---|---|---|
| Gallagher Timothy M | -- | None Available |
Source: Public Records
Mortgage History
| Date | Status | Borrower | Loan Amount |
|---|---|---|---|
| Open | Gallagher Timothy M | $74,100 |
Source: Public Records
Tax History
| Year | Tax Paid | Tax Assessment Tax Assessment Total Assessment is a certain percentage of the fair market value that is determined by local assessors to be the total taxable value of land and additions on the property. | Land | Improvement |
|---|---|---|---|---|
| 2025 | $2,512 | $212,800 | $9,500 | $203,300 |
| 2024 | $2,271 | $186,000 | $9,500 | $176,500 |
| 2023 | $2,271 | $169,400 | $9,500 | $159,900 |
| 2022 | $2,203 | $158,900 | $9,500 | $149,400 |
| 2021 | $1,694 | $129,300 | $9,500 | $119,800 |
| 2020 | $1,407 | $114,900 | $9,500 | $105,400 |
| 2019 | $1,263 | $107,100 | $9,100 | $98,000 |
| 2018 | $1,135 | $99,600 | $9,100 | $90,500 |
| 2017 | $1,172 | $100,400 | $9,100 | $91,300 |
| 2016 | $1,058 | $92,300 | $9,100 | $83,200 |
| 2014 | $1,020 | $92,400 | $9,100 | $83,300 |
| 2013 | $1,022 | $94,000 | $9,100 | $84,900 |
Source: Public Records
Map
Nearby Homes
- 2021 Ticen Ct
- 1901 Main St
- 2215 Albany St
- 225 Clark Ave
- 39 N 18th Ave
- 2118 Newcomer Ln
- 2214 Mann Dr
- 1611 Main St
- 69 N 16th Ave
- 306 N 18th Ave
- 2832 S Oakland Ave
- 3106 E Sumner Ave
- 3011 Cameron St
- 430 N 18th Ave
- 3027 Alice Ave
- 2021 Prospect St
- 1639 E Southern Ave
- 1624 Capra Ct
- 1614 Capra Ct
- 1005 Main St
Your Personal Tour Guide
Ask me questions while you tour the home.