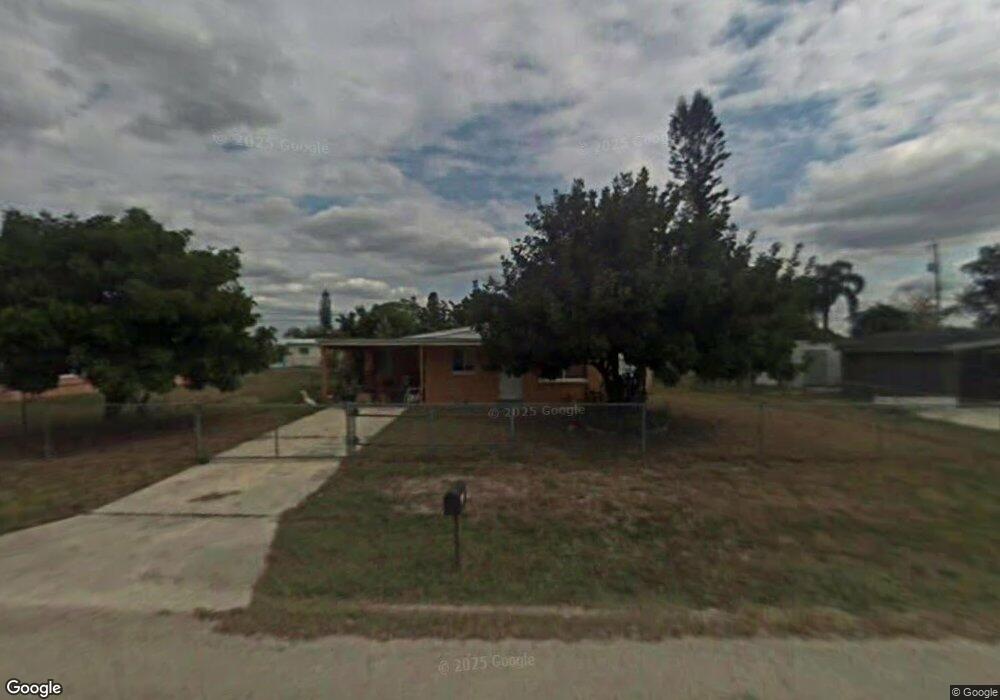
202 Apache St Lehigh Acres, FL 33936
Alabama NeighborhoodEstimated Value: $203,487 - $227,000
4
Beds
1
Bath
1,220
Sq Ft
$181/Sq Ft
Est. Value
About This Home
This home is located at 202 Apache St, Lehigh Acres, FL 33936 and is currently estimated at $221,122, approximately $181 per square foot. 202 Apache St is a home located in Lee County with nearby schools including Lehigh Elementary School, Gateway Elementary School, and The Alva School.
Ownership History
Date
Name
Owned For
Owner Type
Purchase Details
Closed on
Sep 5, 2003
Sold by
Barsol Erdmuie and Barick Bernd
Bought by
Ambroise Lesly and Ambroise Adeline B
Current Estimated Value
Purchase Details
Closed on
Jun 11, 2002
Sold by
Gionfriddo Barry and Gionfriddo Wendy
Bought by
Porter Ceciele and Young Kurlene
Purchase Details
Closed on
Apr 17, 1998
Sold by
Schoffstall Mary Louise
Bought by
Schoffstall Mary Louise
Purchase Details
Closed on
Sep 30, 1994
Sold by
Hummel Betty L
Bought by
Dev Land Inc
Purchase Details
Closed on
May 7, 1994
Sold by
Clutter Albert R and Clutter Dorothy M
Bought by
Wehrmacher Gerhard
Purchase Details
Closed on
Mar 24, 1994
Sold by
Shook Sandra K
Bought by
Nicely Cecil J and Nicely Charlotte R
Purchase Details
Closed on
Mar 21, 1994
Sold by
Jones Martha L
Bought by
Nicely Cicil J and Nicely Charolotte R
Purchase Details
Closed on
Oct 30, 1993
Sold by
Ducran Lloyd
Bought by
Roomes Stanford Livingston
Purchase Details
Closed on
Sep 21, 1993
Sold by
Haddan Bruce C
Bought by
Haddan Bruce C
Create a Home Valuation Report for This Property
The Home Valuation Report is an in-depth analysis detailing your home's value as well as a comparison with similar homes in the area
Home Values in the Area
Average Home Value in this Area
Purchase History
| Date | Buyer | Sale Price | Title Company |
|---|---|---|---|
| Ambroise Lesly | $8,000 | -- | |
| Porter Ceciele | $2,500 | -- | |
| Schoffstall Mary Louise | -- | -- | |
| Dev Land Inc | $900 | -- | |
| Wehrmacher Gerhard | $3,000 | -- | |
| Nicely Cecil J | $31,600 | -- | |
| Nicely Cicil J | -- | -- | |
| Roomes Stanford Livingston | $3,500 | -- | |
| Haddan Bruce C | -- | -- |
Source: Public Records
Tax History
| Year | Tax Paid | Tax Assessment Tax Assessment Total Assessment is a certain percentage of the fair market value that is determined by local assessors to be the total taxable value of land and additions on the property. | Land | Improvement |
|---|---|---|---|---|
| 2025 | $821 | $32,288 | -- | -- |
| 2024 | $663 | $31,378 | -- | -- |
| 2023 | $741 | $30,464 | $0 | $0 |
| 2022 | $663 | $29,577 | $0 | $0 |
| 2021 | $580 | $102,685 | $12,157 | $90,528 |
| 2020 | $535 | $26,024 | $0 | $0 |
| 2019 | $620 | $25,439 | $0 | $0 |
Source: Public Records
Map
Nearby Homes
- 121 Andros St
- 124 Andros St
- 1109 Gifford Ave N
- 1102 Kanza Ct
- 2 Tangelo Ct
- 1164 Navajo Ave
- 10 Tangelo Ct
- 63 Tangelo Ct
- 1169 Cherokee Ave
- 1154 Navajo Ave
- 306 Canyon Dr N
- 13 Hamlin Ct
- 326 Morgan Cir N
- 18 Hamlin Ct
- 801 Perry Ave
- 28 Temple Ct
- 10548 Quincy Ct
- 9245 Aegean Cir
- 18763 Copperhead Ct N
- 10438 Lakeport Ct
Your Personal Tour Guide
Ask me questions while you tour the home.