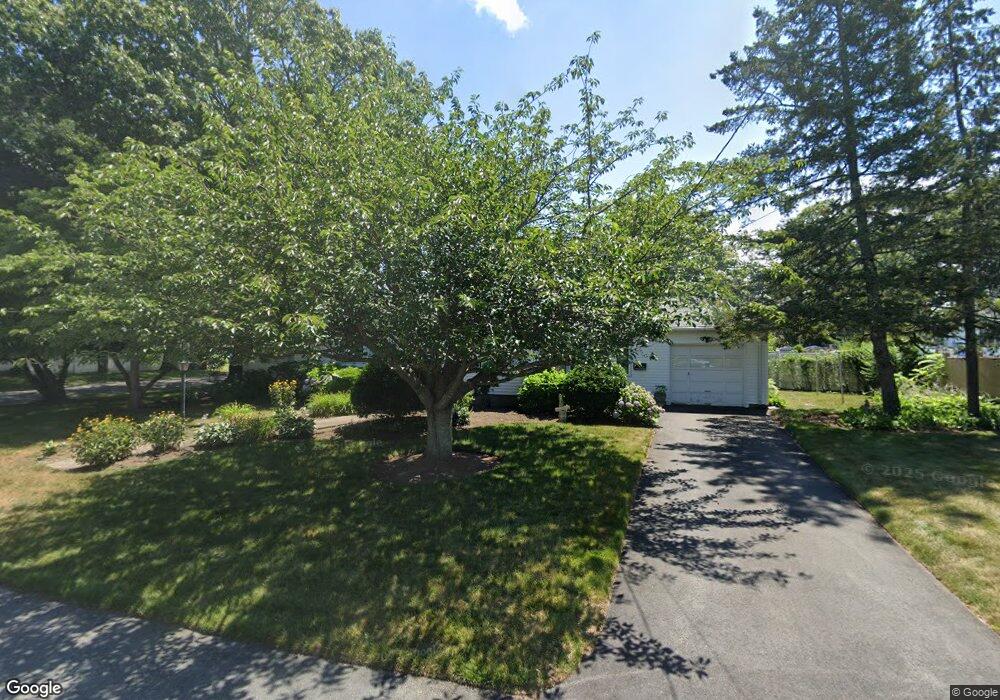
202 Carolyn St Warwick, RI 02886
Hillsgrove NeighborhoodEstimated Value: $366,000 - $406,000
3
Beds
1
Bath
1,008
Sq Ft
$381/Sq Ft
Est. Value
About This Home
This home is located at 202 Carolyn St, Warwick, RI 02886 and is currently estimated at $384,431, approximately $381 per square foot. 202 Carolyn St is a home located in Kent County with nearby schools including St Rose Of Lima School.
Ownership History
Date
Name
Owned For
Owner Type
Purchase Details
Closed on
Jul 13, 2022
Sold by
Bertin Beatrice F
Bought by
Bertin Erik and Bertin Daniel F
Current Estimated Value
Purchase Details
Closed on
May 20, 2022
Sold by
Fleming Brian
Bought by
Bertin Erik and Bertin Daniel F
Purchase Details
Closed on
Feb 6, 2020
Sold by
Fleming Howard F
Bought by
Fleming Brian
Create a Home Valuation Report for This Property
The Home Valuation Report is an in-depth analysis detailing your home's value as well as a comparison with similar homes in the area
Home Values in the Area
Average Home Value in this Area
Purchase History
| Date | Buyer | Sale Price | Title Company |
|---|---|---|---|
| Bertin Erik | -- | None Available | |
| Bertin Erik | -- | None Available | |
| Fleming Brian | -- | None Available |
Source: Public Records
Tax History
| Year | Tax Paid | Tax Assessment Tax Assessment Total Assessment is a certain percentage of the fair market value that is determined by local assessors to be the total taxable value of land and additions on the property. | Land | Improvement |
|---|---|---|---|---|
| 2025 | $4,172 | $328,500 | $104,000 | $224,500 |
| 2024 | $3,916 | $270,600 | $90,400 | $180,200 |
| 2023 | $3,840 | $270,600 | $90,400 | $180,200 |
| 2022 | $3,596 | $192,000 | $59,100 | $132,900 |
| 2021 | $3,596 | $192,000 | $59,100 | $132,900 |
| 2020 | $3,596 | $192,000 | $59,100 | $132,900 |
| 2019 | $3,596 | $192,000 | $59,100 | $132,900 |
| 2018 | $3,043 | $146,300 | $55,800 | $90,500 |
| 2017 | $2,961 | $146,300 | $55,800 | $90,500 |
| 2016 | $2,961 | $146,300 | $55,800 | $90,500 |
| 2015 | $2,785 | $134,200 | $58,400 | $75,800 |
| 2014 | $2,692 | $134,200 | $58,400 | $75,800 |
| 2013 | $2,636 | $133,200 | $58,400 | $74,800 |
Source: Public Records
Map
Nearby Homes
- 66 Child Ln
- 88 Child Ln
- 130 Brentwood Ave
- 51 Red Maple Ln
- 74 Stephens Ave
- 15 Link St
- 28 Burgess Dr
- 54 Carpenter St
- 16 Arrow Ave
- 0 Larkin Ave
- 104 Larkin Ave
- 46 Galant Dr
- 24 Johnson Ave
- 233 Palace Ave
- 207 Morse Ave
- 107 Keystone Dr Unit 116
- 64 Ormsby Ave
- 652 Main Ave
- 70 Turner St Unit 2
- 70 Turner St Unit 1
Your Personal Tour Guide
Ask me questions while you tour the home.