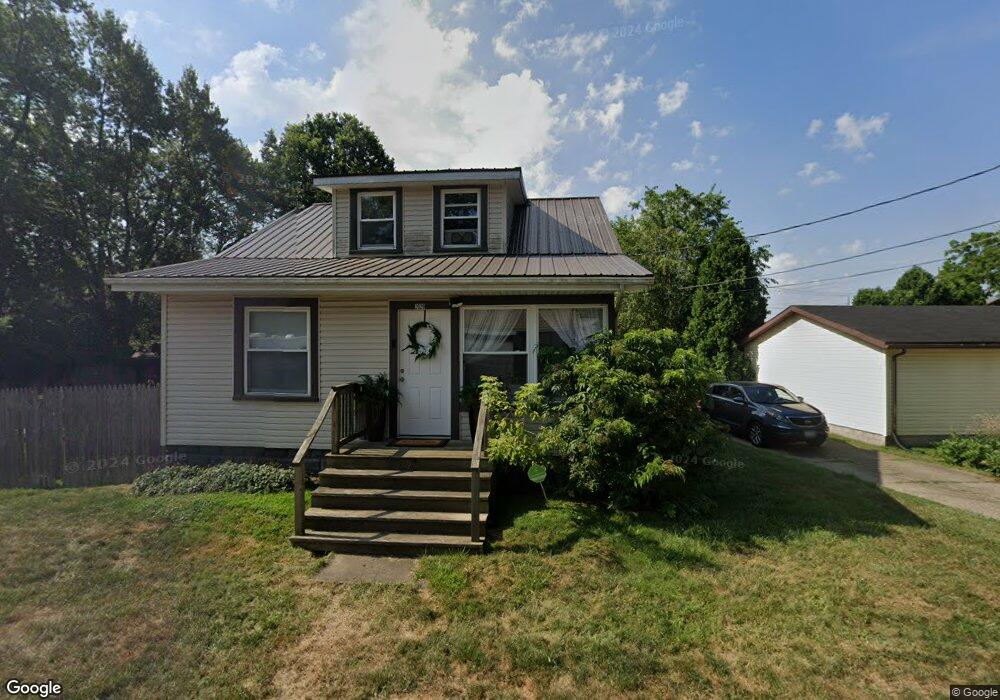
2020 26th St NE Canton, OH 44705
Fairmount NeighborhoodEstimated Value: $85,000 - $122,000
3
Beds
1
Bath
1,164
Sq Ft
$92/Sq Ft
Est. Value
About This Home
This home is located at 2020 26th St NE, Canton, OH 44705 and is currently estimated at $107,667, approximately $92 per square foot. 2020 26th St NE is a home located in Stark County with nearby schools including Frazer Elementary School, Glenwood Intermediate School, and GlenOak High School.
Ownership History
Date
Name
Owned For
Owner Type
Purchase Details
Closed on
Jul 13, 2021
Sold by
Columbia Holdings Llc
Bought by
Sapphire Properties Of Oho Llc
Current Estimated Value
Home Financials for this Owner
Home Financials are based on the most recent Mortgage that was taken out on this home.
Original Mortgage
$953,520
Outstanding Balance
$797,669
Interest Rate
2.9%
Mortgage Type
Future Advance Clause Open End Mortgage
Estimated Equity
-$690,002
Purchase Details
Closed on
Dec 21, 2016
Sold by
Premier Homes Inc
Bought by
Columbia Holdings Llc
Home Financials for this Owner
Home Financials are based on the most recent Mortgage that was taken out on this home.
Original Mortgage
$53,600
Interest Rate
4.03%
Mortgage Type
New Conventional
Purchase Details
Closed on
May 16, 2014
Sold by
Premier Homes Inc
Bought by
Craft Jeff
Purchase Details
Closed on
Jan 15, 2014
Sold by
Mayberry Rhoda and Underwood Rhoda
Bought by
Premier Homes Inc
Purchase Details
Closed on
Sep 22, 1998
Sold by
Underwood James
Bought by
Mayberry Rhoda
Create a Home Valuation Report for This Property
The Home Valuation Report is an in-depth analysis detailing your home's value as well as a comparison with similar homes in the area
Home Values in the Area
Average Home Value in this Area
Purchase History
| Date | Buyer | Sale Price | Title Company |
|---|---|---|---|
| Sapphire Properties Of Oho Llc | $449,600 | None Available | |
| Columbia Holdings Llc | $67,000 | None Available | |
| Craft Jeff | $30,000 | None Available | |
| Premier Homes Inc | $2,700 | None Available | |
| Mayberry Rhoda | $14,850 | -- |
Source: Public Records
Mortgage History
| Date | Status | Borrower | Loan Amount |
|---|---|---|---|
| Open | Sapphire Properties Of Oho Llc | $953,520 | |
| Previous Owner | Columbia Holdings Llc | $53,600 |
Source: Public Records
Tax History
| Year | Tax Paid | Tax Assessment Tax Assessment Total Assessment is a certain percentage of the fair market value that is determined by local assessors to be the total taxable value of land and additions on the property. | Land | Improvement |
|---|---|---|---|---|
| 2025 | -- | $32,700 | $7,600 | $25,100 |
| 2024 | -- | $32,700 | $7,600 | $25,100 |
| 2023 | $912 | $19,150 | $3,850 | $15,300 |
| 2022 | $915 | $19,150 | $3,850 | $15,300 |
| 2021 | $919 | $19,150 | $3,850 | $15,300 |
| 2020 | $1,043 | $19,750 | $3,330 | $16,420 |
| 2019 | $1,035 | $19,750 | $3,330 | $16,420 |
Source: Public Records
Map
Nearby Homes
- 2616 Taft Ave NE
- 2111 21st St NE
- 2235 20th St NE
- 1629 23rd St NE
- 1825 Bernice Ct NE
- 1610 23rd St NE
- 1529 23rd St NE
- 2010 18th St NE
- 1528 22nd St NE
- 1857 Maple Ave NE
- 1742 Taft Ave NE
- 1824 Root Ave NE
- 2005 17th St NE
- 2211 17th St NE
- 2216 17th St NE
- 3002 Root Ave NE
- 1316 22nd St NE
- 2656 22nd St NE
- 1811 Grace Ave NE
- 2106 Indiana Way NE
- 2516 Harrisburg Rd NE
- 2516 Harrisburg Rd NE
- 2520 Harrisburg Rd NE
- 2524 Harrisburg Rd NE
- 2100 26th St NE
- 2510 Harrisburg Rd NE
- 2600 Harrisburg Rd NE
- 2013 25th St NE
- 2106 26th St NE
- 2019 25th St NE
- 2502 Harrisburg Rd NE
- 2103 26th St NE
- 2021 25th St NE
- 2114 26th St NE
- 2114 26th St NE
- 2016 Harmon St NE
- 2028 Harmon St NE
- 2519 Harrisburg Rd NE
- 2519 Harrisburg Rd NE
- 2113 26th St NE
Your Personal Tour Guide
Ask me questions while you tour the home.