2021 E High St Springfield, OH 45505
Estimated Value: $212,000 - $275,000
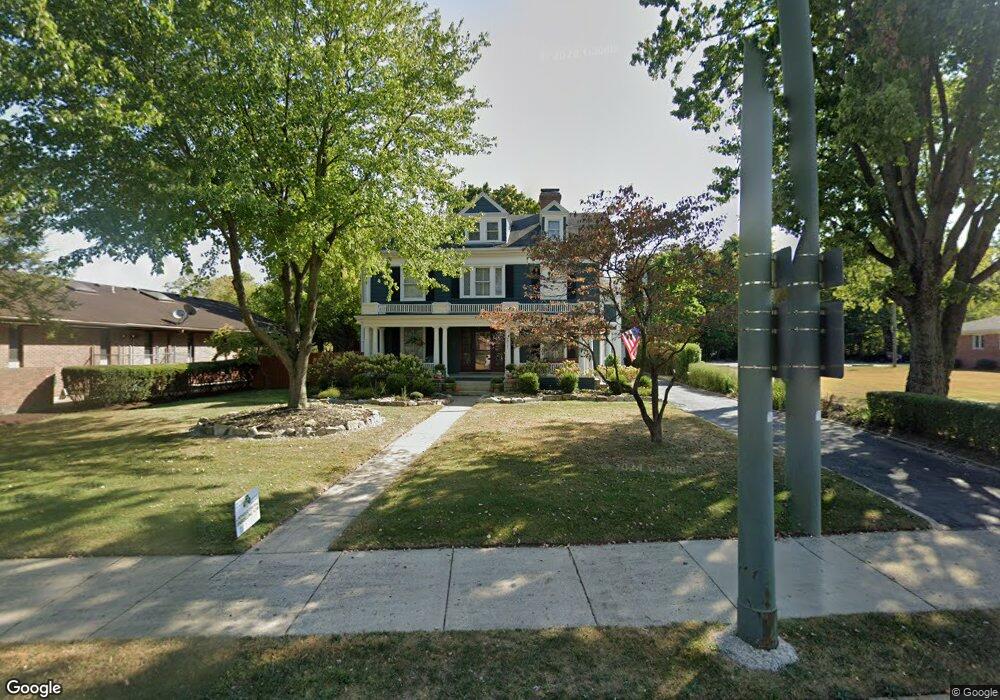
About This Home
This home is located at 2021 E High St, Springfield, OH 45505 and is currently estimated at $234,561, approximately $60 per square foot. 2021 E High St is a home located in Clark County with nearby schools including Mann Elementary School, Schaefer Middle School, and Springfield High School.
Ownership History
We collect this data history from publicly available records. To have your information removed, we recommend requesting removal directly through your county’s website.
Purchase Details
Home Financials for this Owner
Home Financials are based on the most recent Mortgage that was taken out on this home.Home Values in the Area
Average Home Value in this Area
Purchase History
We collect this data history from publicly available records. To have your information removed, we recommend requesting removal directly through your county’s website.
| Date | Buyer | Sale Price | Title Company |
|---|---|---|---|
| $99,500 | Attorney |
Mortgage History
We collect this data history from publicly available records. To have your information removed, we recommend requesting removal directly through your county’s website.
| Date | Status | Borrower | Loan Amount |
|---|---|---|---|
| Previous Owner | $79,600 |
Tax History
We collect this data history from publicly available records. To have your information removed, we recommend requesting removal directly through your county’s website.
| Year | Tax Paid | Tax Assessment Tax Assessment Total Assessment is a certain percentage of the fair market value that is determined by local assessors to be the total taxable value of land and additions on the property. | Land | Improvement |
|---|---|---|---|---|
| 2025 | $2,658 | $67,700 | $8,600 | $59,100 |
| 2024 | $2,589 | $53,720 | $7,920 | $45,800 |
| 2023 | $2,589 | $53,720 | $7,920 | $45,800 |
| 2022 | $2,652 | $53,720 | $7,920 | $45,800 |
| 2021 | $2,239 | $41,870 | $6,140 | $35,730 |
| 2020 | $2,244 | $41,870 | $6,140 | $35,730 |
| 2019 | $2,249 | $41,870 | $6,140 | $35,730 |
| 2018 | $2,055 | $36,750 | $6,980 | $29,770 |
| 2017 | $2,054 | $58,878 | $6,976 | $51,902 |
| 2016 | $2,057 | $58,878 | $6,976 | $51,902 |
| 2015 | $3,113 | $63,291 | $6,976 | $56,315 |
| 2014 | $3,099 | $63,291 | $6,976 | $56,315 |
| 2013 | $3,066 | $63,291 | $6,976 | $56,315 |
Map
- 26 N Belmont Ave
- 280 S Clairmont Ave
- 306 S Clairmont Ave
- 266 S Clairmont Ave
- 270 S Clairmont Ave
- 302 S Clairmont Ave
- 264 S Clairmont Ave
- 356 Linwood Ave
- 273 Raffensperger Ave
- 263 Raffensperger Ave
- 283 Raffensperger Ave
- 204 Belleaire Ave
- 1726 Morgan St
- 374 Raffensperger Ave
- 1721 Prospect St
- 1621 Morgan St
- 1501 E High St
- 621 S Douglas Ave
- 111 S Burnett Rd
- 115 S Burnett Rd
- 225 S Douglas Ave
- 202 S Belmont Ave
- 233 S Douglas Ave
- 228 S Belmont Ave
- 222 S Douglas Ave Unit 224
- 228 S Douglas Ave
- 1929 E High St
- 234 S Douglas Ave
- 253 S Douglas Ave
- 252 S Belmont Ave
- 257 S Douglas Ave
- 2121 E High St
- 2100 E High St
- 2100 E High St
- 225 S Arlington Ave
- 266 S Belmont Ave
- 263 S Douglas Ave
- 229 S Arlington Ave
- 2115 Kenilworth Ave
- 1920 E High St
Ask me questions while you tour the home.