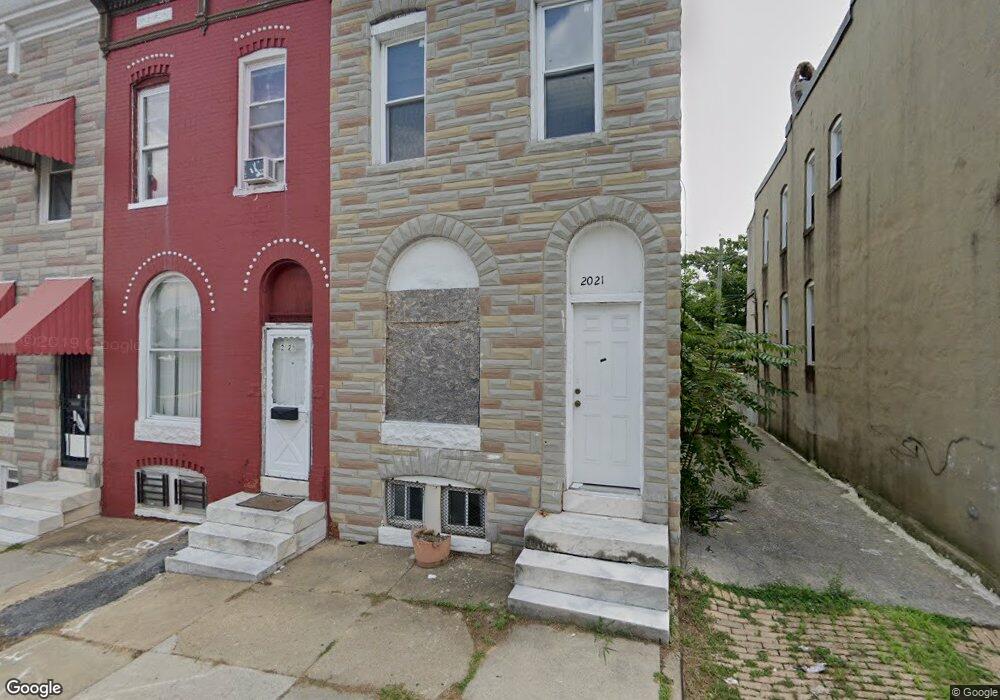
2023 N Payson St Baltimore, MD 21217
Mondawmin NeighborhoodEstimated Value: $167,000 - $179,566
Studio
--
Bath
633
Sq Ft
$274/Sq Ft
Est. Value
About This Home
This home is located at 2023 N Payson St, Baltimore, MD 21217 and is currently estimated at $173,283, approximately $273 per square foot. 2023 N Payson St is a home located in Baltimore City with nearby schools including Robert W. Coleman Elementary School, Booker T. Washington Middle School, and Frederick Douglass High School.
Ownership History
Date
Name
Owned For
Owner Type
Purchase Details
Closed on
Aug 24, 2010
Sold by
Saka Khadija
Bought by
Adedokun Musibau A
Current Estimated Value
Purchase Details
Closed on
Oct 2, 2007
Sold by
Brown Jerold J
Bought by
Saka Khadija
Purchase Details
Closed on
Jun 18, 2003
Sold by
2023 N Payson Street
Bought by
Brown Jerold J
Purchase Details
Closed on
Mar 12, 2003
Sold by
Flagstar Bank F S B
Bought by
2023 N Payson Street and Land Trust
Purchase Details
Closed on
Jan 21, 2003
Sold by
Nguyen Tam
Bought by
Flagstar Bank F S B
Purchase Details
Closed on
Nov 5, 2001
Sold by
Millennium Properties Inc
Bought by
Nguyen Tam
Purchase Details
Closed on
Jun 25, 2001
Sold by
Cit Group & Consumer
Bought by
Millennium Properties Inc
Purchase Details
Closed on
May 11, 2000
Sold by
Henderson Steven
Bought by
Henderson Steven
Purchase Details
Closed on
Jan 11, 1999
Sold by
Gozo Makushamari
Bought by
Henderson Steven
Purchase Details
Closed on
Sep 1, 1998
Sold by
Klein Michael B
Bought by
Gozo Makushamari
Purchase Details
Closed on
Aug 6, 1998
Sold by
Victor Investments Inc
Bought by
Klein Michael B
Create a Home Valuation Report for This Property
The Home Valuation Report is an in-depth analysis detailing your home's value as well as a comparison with similar homes in the area
Home Values in the Area
Average Home Value in this Area
Purchase History
| Date | Buyer | Sale Price | Title Company |
|---|---|---|---|
| Adedokun Musibau A | $90,000 | -- | |
| Saka Khadija | $85,000 | -- | |
| Brown Jerold J | $53,000 | -- | |
| 2023 N Payson Street | $11,000 | -- | |
| Flagstar Bank F S B | $42,000 | -- | |
| Nguyen Tam | $45,000 | -- | |
| Millennium Properties Inc | $6,000 | -- | |
| Henderson Steven | $34,000 | -- | |
| Henderson Steven | $26,000 | -- | |
| Gozo Makushamari | $21,000 | -- | |
| Klein Michael B | $8,100 | -- |
Source: Public Records
Tax History
| Year | Tax Paid | Tax Assessment Tax Assessment Total Assessment is a certain percentage of the fair market value that is determined by local assessors to be the total taxable value of land and additions on the property. | Land | Improvement |
|---|---|---|---|---|
| 2025 | $434 | $21,000 | $4,000 | $17,000 |
| 2024 | $434 | $20,333 | -- | -- |
| 2023 | $464 | $19,667 | $0 | $0 |
| 2022 | $407 | $19,000 | $4,000 | $15,000 |
| 2021 | $448 | $19,000 | $4,000 | $15,000 |
| 2020 | $406 | $19,000 | $4,000 | $15,000 |
| 2019 | $445 | $21,000 | $4,000 | $17,000 |
| 2018 | $453 | $21,000 | $4,000 | $17,000 |
| 2017 | $459 | $21,000 | $0 | $0 |
| 2016 | $71 | $3,000 | $0 | $0 |
| 2015 | $71 | $3,000 | $0 | $0 |
| 2014 | $71 | $3,000 | $0 | $0 |
Source: Public Records
Map
Nearby Homes
- 2011 N Payson St
- 2006 Walbrook Ave
- 1926 N Payson St
- 1908 Walbrook Ave
- 2032 Walbrook Ave
- 1828 Walbrook Ave
- 1817 Clifton Ave
- 2109 Ridgehill Ave
- 1818 Clifton Ave
- 2019 N Smallwood St
- 2022 N Fulton Ave
- 2100 N Fulton Ave
- 2106 N Fulton Ave
- 1922 N Fulton Ave
- 2100 N Smallwood St
- 1812 N Payson St
- 2033 N Fulton Ave
- 1815 N Pulaski St
- 1802 N Payson St
- 1800 N Payson St
- 2021 N Payson St
- 2025 N Payson St
- 2027 N Payson St
- 2019 N Payson St
- 2017 N Payson St
- 2029 N Payson St
- 1947 Clifton Ave
- 2015 N Payson St
- 1945 Clifton Ave
- 2013 N Payson St
- 1943 Clifton Ave
- 1952 Ridgehill Ave
- 1950 Ridgehill Ave
- 1941 Clifton Ave
- 1948 Ridgehill Ave
- 1939 Clifton Ave
- 1946 Ridgehill Ave
- 1944 Ridgehill Ave
- 1937 Clifton Ave
- 2009 N Payson St
Your Personal Tour Guide
Ask me questions while you tour the home.