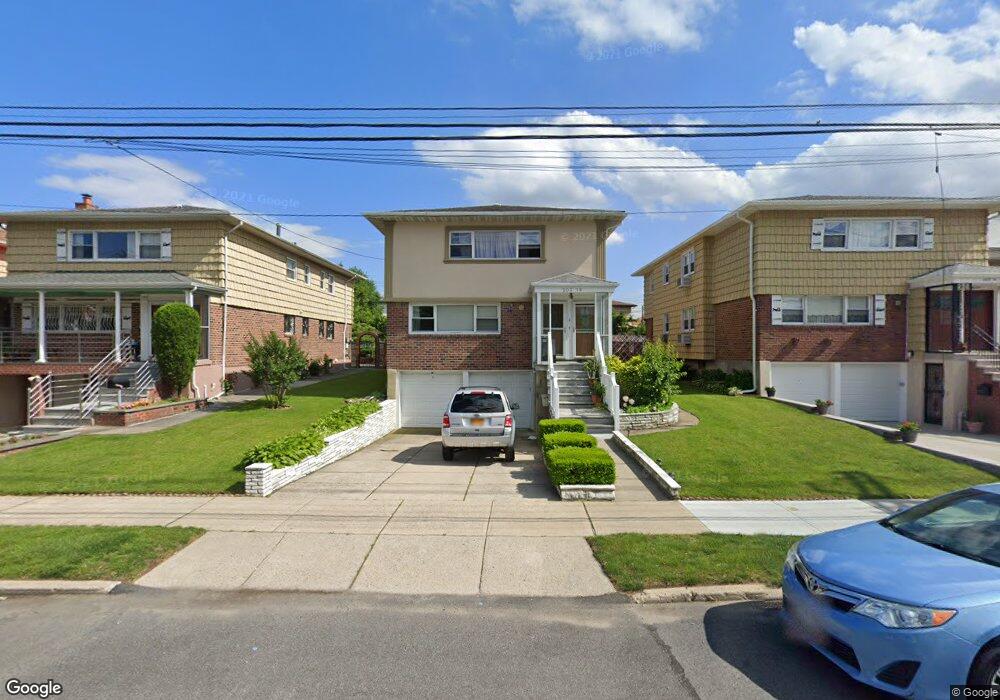
203-18 26th Ave Unit 2nd Fl Flushing, NY 11360
Auburndale NeighborhoodEstimated Value: $1,624,334 - $2,009,000
3
Beds
2
Baths
1,300
Sq Ft
$1,408/Sq Ft
Est. Value
About This Home
This home is located at 203-18 26th Ave Unit 2nd Fl, Flushing, NY 11360 and is currently estimated at $1,830,084, approximately $1,407 per square foot. 203-18 26th Ave Unit 2nd Fl is a home located in Queens County with nearby schools including P.S. 159 Queens, I.S. 25 Adrien Block, and Bayside High School.
Ownership History
Date
Name
Owned For
Owner Type
Purchase Details
Closed on
Sep 19, 2024
Sold by
Of The Estate Of Mary Del Basso and Steven Del Basso
Bought by
Delbasso Steven
Current Estimated Value
Create a Home Valuation Report for This Property
The Home Valuation Report is an in-depth analysis detailing your home's value as well as a comparison with similar homes in the area
Home Values in the Area
Average Home Value in this Area
Purchase History
| Date | Buyer | Sale Price | Title Company |
|---|---|---|---|
| Delbasso Steven | -- | -- | |
| Delbasso Steven | -- | -- |
Source: Public Records
Tax History
| Year | Tax Paid | Tax Assessment Tax Assessment Total Assessment is a certain percentage of the fair market value that is determined by local assessors to be the total taxable value of land and additions on the property. | Land | Improvement |
|---|---|---|---|---|
| 2025 | $7,713 | $84,401 | $13,665 | $70,736 |
| 2024 | $7,817 | $84,401 | $13,233 | $71,168 |
| 2023 | $16,172 | $80,518 | $12,943 | $67,575 |
| 2022 | $6,923 | $104,940 | $18,720 | $86,220 |
| 2021 | $6,882 | $98,280 | $18,720 | $79,560 |
| 2020 | $6,785 | $93,360 | $18,720 | $74,640 |
| 2019 | $8,905 | $84,000 | $18,720 | $65,280 |
| 2018 | $13,380 | $67,098 | $17,954 | $49,144 |
| 2017 | $12,604 | $63,300 | $16,201 | $47,099 |
| 2016 | $11,629 | $63,300 | $16,201 | $47,099 |
| 2015 | $6,983 | $58,612 | $17,091 | $41,521 |
| 2014 | $6,983 | $58,612 | $19,351 | $39,261 |
Source: Public Records
Map
Nearby Homes
- 27-15 203rd St
- 201-04 24th Rd
- 201-02 27th Ave
- 2630 Clearview Expy
- 199-27 26th Ave
- 2615 Clearview Expy
- 28-18 200th St
- 2623 Utopia Pkwy
- 21-38 202nd St Unit 1-208
- 19947 22nd Ave Unit Upper
- 208-22 26th Ave
- 21-20 202nd St Unit 1-189
- 21-47 Utopia Pkwy Unit 2
- 21-29 Utopia Pkwy Unit UPSTAIRS
- 21-41 Utopia Pkwy Unit LOWER
- 28-07 172nd St
- 20921 26th Ave Unit 2D
- 32-13 202nd St
- 19916 21st Ave Unit 1336
- 3226 204th St
- 203-18 26th Ave
- 20318 26th Ave
- 20322 26th Ave
- 20314 26th Ave
- 20402 26th Ave
- 2607 203rd St
- 26-03 203rd St
- 20325 27th Ave
- 20406 26th Ave
- 20321 27th Ave
- 2611 203rd St
- 26-11 203rd St Unit 2Fl
- 203-29 27 Ave
- 203-29 27th Ave
- 20329 27th Ave
- 203-25 27th Ave
- 2603 203rd St Unit 2
- 2603 203rd St
- 2603 203rd St
- 20315 27th Ave
Your Personal Tour Guide
Ask me questions while you tour the home.