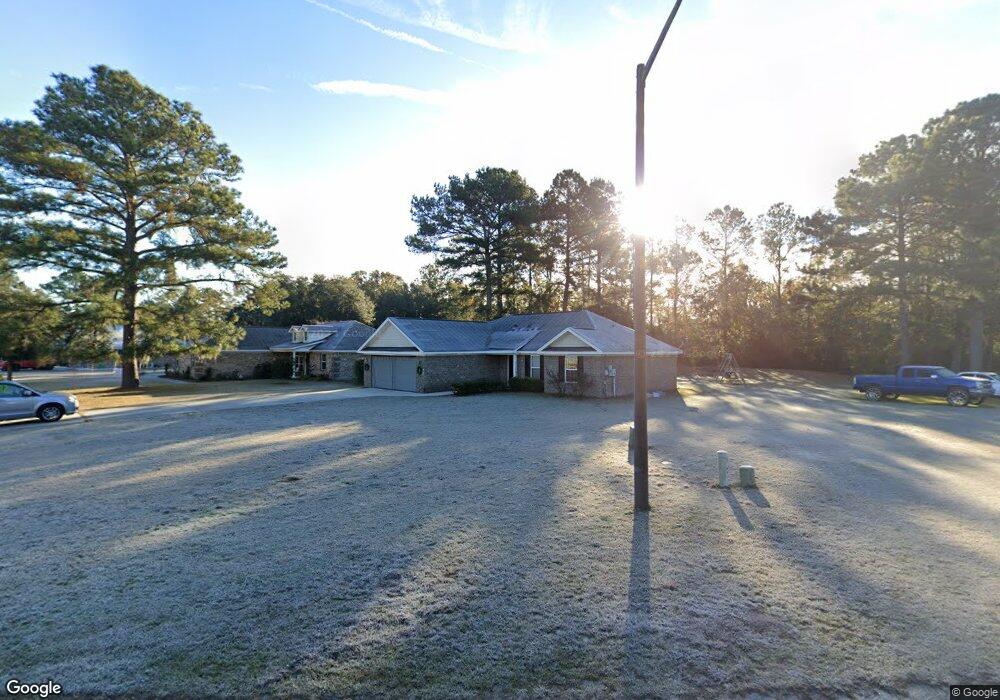
203 Matt Ct Rincon, GA 31326
Estimated Value: $314,000 - $350,000
About This Home
This home is located at 203 Matt Ct, Rincon, GA 31326 and is currently estimated at $332,228, approximately $174 per square foot. 203 Matt Ct is a home located in Effingham County with nearby schools including South Effingham Elementary School, South Effingham Middle School, and South Effingham High School.
Ownership History
We collect this data history from publicly available records. To have your information removed, we recommend requesting removal directly through your county’s website.
Purchase Details
Home Financials for this Owner
Home Financials are based on the most recent Mortgage that was taken out on this home.Home Values in the Area
Average Home Value in this Area
Purchase History
We collect this data history from publicly available records. To have your information removed, we recommend requesting removal directly through your county’s website.
| Date | Buyer | Sale Price | Title Company |
|---|---|---|---|
| $169,900 | -- |
Mortgage History
We collect this data history from publicly available records. To have your information removed, we recommend requesting removal directly through your county’s website.
| Date | Status | Borrower | Loan Amount |
|---|---|---|---|
| Open | $133,900 |
Tax History
We collect this data history from publicly available records. To have your information removed, we recommend requesting removal directly through your county’s website.
| Year | Tax Paid | Tax Assessment Tax Assessment Total Assessment is a certain percentage of the fair market value that is determined by local assessors to be the total taxable value of land and additions on the property. | Land | Improvement |
|---|---|---|---|---|
| 2025 | $2,672 | $111,416 | $22,800 | $88,616 |
| 2024 | $2,672 | $120,805 | $22,800 | $98,005 |
| 2023 | $1,826 | $98,833 | $18,800 | $80,033 |
| 2022 | $2,326 | $76,253 | $14,000 | $62,253 |
| 2021 | $2,267 | $72,214 | $14,000 | $58,214 |
| 2020 | $2,205 | $68,232 | $14,000 | $54,232 |
| 2019 | $2,083 | $63,650 | $14,000 | $49,650 |
| 2018 | $2,061 | $62,166 | $14,000 | $48,166 |
| 2017 | $2,013 | $60,055 | $14,000 | $46,055 |
| 2016 | $1,996 | $62,469 | $16,800 | $45,669 |
| 2015 | $1,859 | $57,669 | $12,000 | $45,669 |
| 2014 | $1,781 | $54,469 | $8,800 | $45,669 |
| 2013 | -- | $50,509 | $4,840 | $45,669 |
Map
- 160 Huger St
- 144 Jennifer Cir
- 110 Katie Dr
- 100 Live Oak Cir
- 106 Goldeneye Dr
- 108 Goldeneye Dr
- 110 Goldeneye Dr
- 124 Barrington Cir
- 604 Goshen Rd
- 433 Exley Loop
- 7 Brookfield Ct
- 139 Fraser Ln
- 127 Crystal Dr
- 327 Purple Plum Dr
- 138 John Glenn Dr
- 127 John Glenn Dr
- 100 Usher Place
- 126 Oak St
- 112 Oak St
- 5475 Mccall Rd
Ask me questions while you tour the home.