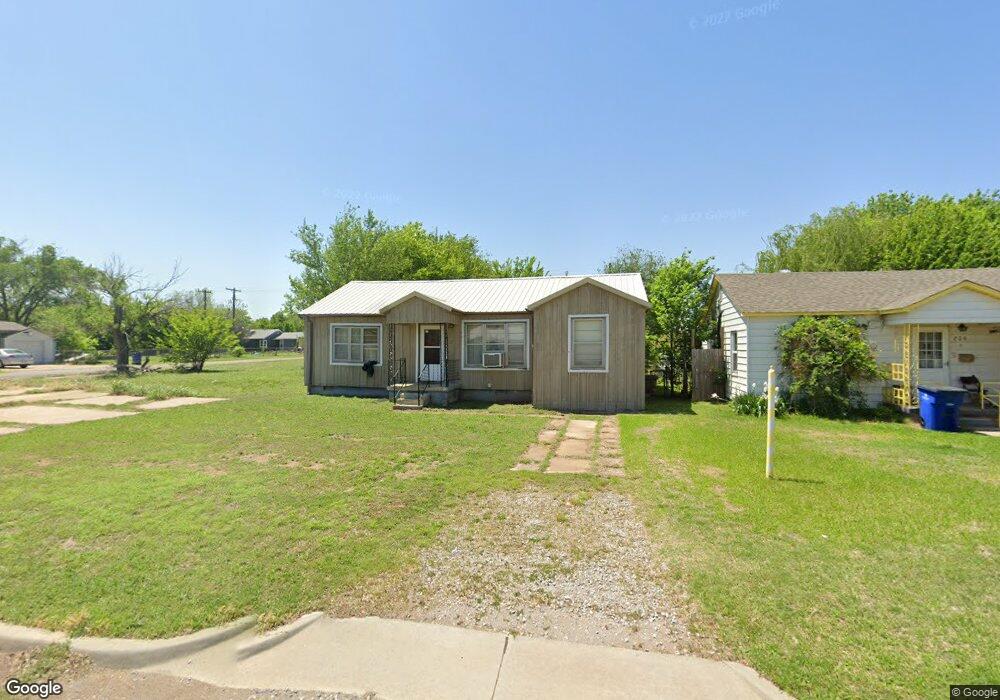
203 N D St Duncan, OK 73533
Estimated Value: $54,000 - $70,000
2
Beds
1
Bath
1,095
Sq Ft
$56/Sq Ft
Est. Value
About This Home
This home is located at 203 N D St, Duncan, OK 73533 and is currently estimated at $61,642, approximately $56 per square foot. 203 N D St is a home located in Stephens County with nearby schools including Woodrow Wilson Elementary School, Duncan Middle School, and Duncan High School.
Ownership History
Date
Name
Owned For
Owner Type
Purchase Details
Closed on
Oct 2, 2017
Sold by
Crowdis Wilbern Owen and Crowdis Rebecca Sue
Bought by
Black Diamond Property & Rentals Llc
Current Estimated Value
Home Financials for this Owner
Home Financials are based on the most recent Mortgage that was taken out on this home.
Original Mortgage
$15,200
Outstanding Balance
$8,195
Interest Rate
3.89%
Mortgage Type
Commercial
Estimated Equity
$53,447
Purchase Details
Closed on
Dec 17, 1992
Sold by
Phelps Kathryn Eloise
Bought by
Crowdis Wilbern Owen
Purchase Details
Closed on
Nov 12, 1992
Sold by
Forker Mary E
Create a Home Valuation Report for This Property
The Home Valuation Report is an in-depth analysis detailing your home's value as well as a comparison with similar homes in the area
Purchase History
We collect this data history from publicly available records. To have your information removed, we recommend requesting removal directly through your county’s website.
| Date | Buyer | Sale Price | Title Company |
|---|---|---|---|
| Black Diamond Property & Rentals Llc | $19,000 | Stephens Co Abstract Co | |
| Crowdis Wilbern Owen | $8,500 | -- | |
| -- | -- | -- |
Source: Public Records
Mortgage History
We collect this data history from publicly available records. To have your information removed, we recommend requesting removal directly through your county’s website.
| Date | Status | Borrower | Loan Amount |
|---|---|---|---|
| Open | Black Diamond Property & Rentals Llc | $15,200 |
Source: Public Records
Tax History
| Year | Tax Paid | Tax Assessment Tax Assessment Total Assessment is a certain percentage of the fair market value that is determined by local assessors to be the total taxable value of land and additions on the property. | Land | Improvement |
|---|---|---|---|---|
| 2025 | $265 | $3,149 | $317 | $2,832 |
| 2024 | $243 | $2,856 | $317 | $2,539 |
| 2023 | $243 | $2,857 | $317 | $2,540 |
| 2022 | $220 | $2,721 | $317 | $2,404 |
| 2021 | $220 | $2,591 | $317 | $2,274 |
| 2020 | $203 | $2,350 | $317 | $2,033 |
| 2019 | $194 | $2,238 | $317 | $1,921 |
| 2018 | $190 | $2,132 | $317 | $1,815 |
| 2017 | $239 | $2,777 | $317 | $2,460 |
| 2016 | $270 | $3,180 | $302 | $2,878 |
| 2015 | $229 | $3,028 | $298 | $2,730 |
| 2014 | $229 | $2,884 | $295 | $2,589 |
Source: Public Records
Map
Nearby Homes
Your Personal Tour Guide
Ask me questions while you tour the home.