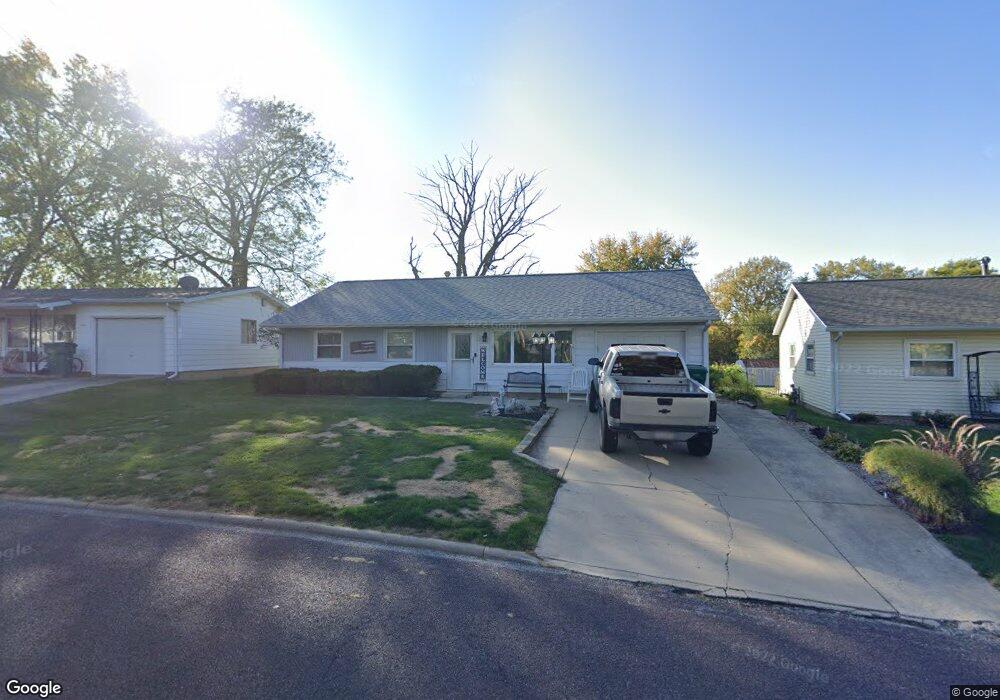
203 Temple Dr Washington, IL 61571
Sunnyland NeighborhoodEstimated Value: $141,000 - $176,000
3
Beds
1
Bath
1,425
Sq Ft
$108/Sq Ft
Est. Value
About This Home
This home is located at 203 Temple Dr, Washington, IL 61571 and is currently estimated at $154,301, approximately $108 per square foot. 203 Temple Dr is a home located in Tazewell County with nearby schools including J L Hensey Elementary School, Beverly Manor Elementary School, and Washington Community High School.
Ownership History
Date
Name
Owned For
Owner Type
Purchase Details
Closed on
Apr 24, 2025
Sold by
Prater Lori and Black Randy
Bought by
Larson Terence
Current Estimated Value
Home Financials for this Owner
Home Financials are based on the most recent Mortgage that was taken out on this home.
Original Mortgage
$108,000
Outstanding Balance
$107,521
Interest Rate
6.65%
Mortgage Type
Credit Line Revolving
Estimated Equity
$46,780
Create a Home Valuation Report for This Property
The Home Valuation Report is an in-depth analysis detailing your home's value as well as a comparison with similar homes in the area
Home Values in the Area
Average Home Value in this Area
Purchase History
We collect this data history from publicly available records. To have your information removed, we recommend requesting removal directly through your county’s website.
| Date | Buyer | Sale Price | Title Company |
|---|---|---|---|
| Larson Terence | $135,000 | None Listed On Document |
Source: Public Records
Mortgage History
We collect this data history from publicly available records. To have your information removed, we recommend requesting removal directly through your county’s website.
| Date | Status | Borrower | Loan Amount |
|---|---|---|---|
| Open | Larson Terence | $108,000 |
Source: Public Records
Tax History
| Year | Tax Paid | Tax Assessment Tax Assessment Total Assessment is a certain percentage of the fair market value that is determined by local assessors to be the total taxable value of land and additions on the property. | Land | Improvement |
|---|---|---|---|---|
| 2025 | $2,381 | $43,530 | $5,770 | $37,760 |
| 2024 | $2,175 | $39,750 | $5,270 | $34,480 |
| 2023 | $2,175 | $36,880 | $4,890 | $31,990 |
| 2022 | $2,050 | $34,460 | $4,570 | $29,890 |
| 2021 | $1,959 | $33,620 | $4,460 | $29,160 |
| 2020 | $1,952 | $33,620 | $4,460 | $29,160 |
| 2019 | $1,916 | $33,620 | $4,460 | $29,160 |
| 2018 | $1,878 | $33,620 | $4,460 | $29,160 |
| 2017 | $1,834 | $32,680 | $4,340 | $28,340 |
| 2016 | $1,791 | $32,680 | $4,340 | $28,340 |
| 2015 | $1,732 | $0 | $0 | $0 |
| 2013 | $1,671 | $10,000 | $10,000 | $0 |
Source: Public Records
Map
Nearby Homes
- 252 Briargate Rd
- 233 Briargate Rd
- 2276 Robin Rd
- 618 Mickel Pkwy
- 107 Florida Ave
- 103 Argo St Unit 105
- 143 Cherry Ln
- 208 S Meadowview Ln
- 304 Dundee Rd
- 102 Laurel Ln
- 1440 School St
- 230 Devron Cir
- 106 Ruth Ct
- 102 Ruth Ct
- 200 Lexington Dr
- 501 Whistling Strait
- 215 Cypress Point
- 100 Joseph Ct
- 103 Joseph Ct
- 107 Samuel Ct
Your Personal Tour Guide
Ask me questions while you tour the home.