203 Union St Waynetown, IN 47990
Estimated Value: $128,000 - $151,308
2
Beds
1
Bath
1,065
Sq Ft
$130/Sq Ft
Est. Value
About This Home
This home is located at 203 Union St, Waynetown, IN 47990 and is currently estimated at $138,827, approximately $130 per square foot. 203 Union St is a home located in Montgomery County with nearby schools including North Montgomery High School.
Ownership History
Date
Name
Owned For
Owner Type
Purchase Details
Closed on
Jun 27, 2016
Sold by
Lmc Investments Llc
Bought by
Deck John L
Current Estimated Value
Home Financials for this Owner
Home Financials are based on the most recent Mortgage that was taken out on this home.
Original Mortgage
$105,000
Outstanding Balance
$43,914
Interest Rate
3.58%
Mortgage Type
New Conventional
Estimated Equity
$94,913
Purchase Details
Closed on
Jan 7, 2011
Sold by
Federal Home Loan Mortgage Corporation
Bought by
Lmc Investments Llc
Purchase Details
Closed on
Nov 9, 2010
Sold by
Philon James
Bought by
Federal Home Loan Mortgage Corporation
Create a Home Valuation Report for This Property
The Home Valuation Report is an in-depth analysis detailing your home's value as well as a comparison with similar homes in the area
Purchase History
| Date | Buyer | Sale Price | Title Company |
|---|---|---|---|
| Deck John L | -- | Partners Title Group Inc | |
| Lmc Investments Llc | -- | None Available | |
| Federal Home Loan Mortgage Corporation | $38,126 | None Available |
Source: Public Records
Mortgage History
| Date | Status | Borrower | Loan Amount |
|---|---|---|---|
| Open | Deck John L | $105,000 |
Source: Public Records
Tax History
| Year | Tax Paid | Tax Assessment Tax Assessment Total Assessment is a certain percentage of the fair market value that is determined by local assessors to be the total taxable value of land and additions on the property. | Land | Improvement |
|---|---|---|---|---|
| 2025 | $2,004 | $114,100 | $22,800 | $91,300 |
| 2024 | $1,865 | $95,900 | $22,800 | $73,100 |
| 2023 | $1,929 | $101,900 | $19,500 | $82,400 |
| 2022 | $1,828 | $91,400 | $19,500 | $71,900 |
| 2021 | $1,698 | $84,900 | $19,500 | $65,400 |
| 2020 | $1,559 | $78,800 | $19,500 | $59,300 |
| 2019 | $1,568 | $79,000 | $19,700 | $59,300 |
| 2018 | $1,068 | $53,500 | $11,700 | $41,800 |
| 2017 | $1,011 | $51,100 | $11,700 | $39,400 |
| 2016 | $985 | $49,300 | $11,700 | $37,600 |
| 2014 | $935 | $50,000 | $11,700 | $38,300 |
| 2013 | $935 | $46,800 | $11,700 | $35,100 |
Source: Public Records
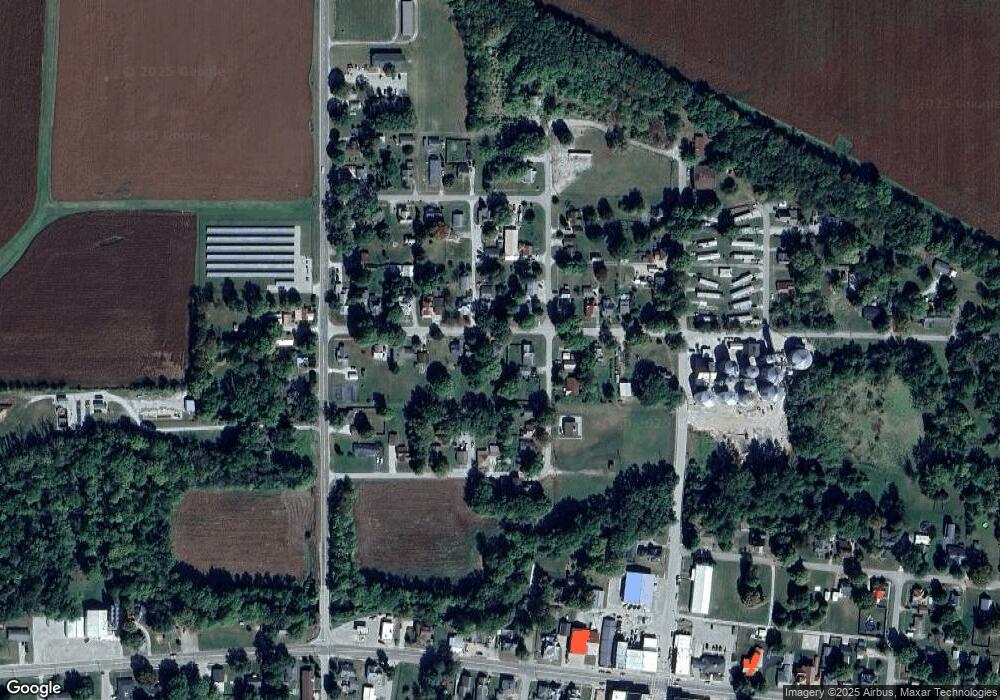
Map
Nearby Homes
- 207 W Union St
- 305 E Union St
- 302 E Washington St
- 9390 W US Highway 136
- 9504 W US Highway 136
- 9596 US Highway 136
- 4881 W US Highway 136
- 4315 U S Highway 136 W
- 2756 E Short Rd
- 205 E Market St
- 1951 E 250 S
- 108 E High St
- 104 E High St
- 4297 W Division Rd
- 4800 N 275 W
- 2525 W 400 N
- N County Road 275 W Unit LotWP01
- North 275 W County Rd
- 4010 W State Road 32
- 3538 N 225 W
Your Personal Tour Guide
Ask me questions while you tour the home.