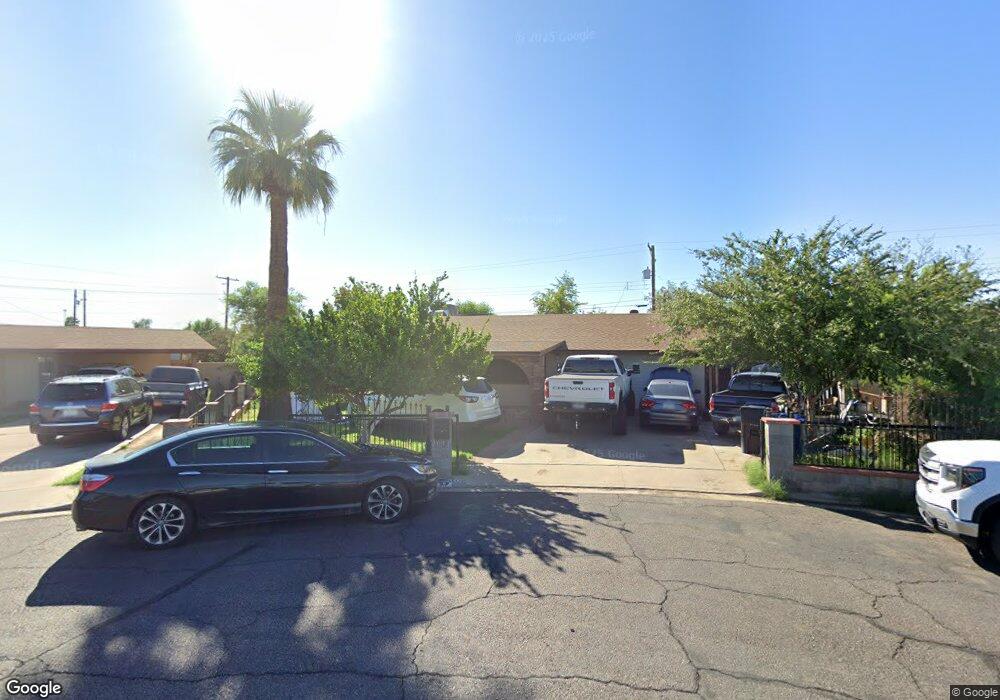
2031 W 2nd Place Mesa, AZ 85201
West Main NeighborhoodEstimated Value: $368,422 - $464,000
Studio
2
Baths
1,571
Sq Ft
$271/Sq Ft
Est. Value
About This Home
This home is located at 2031 W 2nd Place, Mesa, AZ 85201 and is currently estimated at $425,856, approximately $271 per square foot. 2031 W 2nd Place is a home located in Maricopa County with nearby schools including Webster Elementary School, Franklin at Brimhall Elementary School, and Franklin West Elementary School.
Ownership History
Date
Name
Owned For
Owner Type
Purchase Details
Closed on
Feb 11, 2021
Sold by
Munoz Jesus M and Munoz Jesse M
Bought by
Munoz Jesus M and Munoz Maria M
Current Estimated Value
Home Financials for this Owner
Home Financials are based on the most recent Mortgage that was taken out on this home.
Original Mortgage
$101,500
Outstanding Balance
$74,641
Interest Rate
2.65%
Mortgage Type
New Conventional
Estimated Equity
$351,215
Purchase Details
Closed on
Sep 30, 1997
Sold by
Hud
Bought by
Munoz Jesse M
Home Financials for this Owner
Home Financials are based on the most recent Mortgage that was taken out on this home.
Original Mortgage
$84,678
Interest Rate
7.49%
Mortgage Type
FHA
Purchase Details
Closed on
Jun 17, 1997
Sold by
Hendon Carl C and Hendon Allen
Bought by
Nationsbanc Mtg Corp
Purchase Details
Closed on
Mar 27, 1995
Sold by
Bishop Heidi
Bought by
Hendon Carl
Purchase Details
Closed on
Mar 23, 1995
Sold by
Hendon Carl C
Bought by
Nolte Steve
Create a Home Valuation Report for This Property
The Home Valuation Report is an in-depth analysis detailing your home's value as well as a comparison with similar homes in the area
Home Values in the Area
Average Home Value in this Area
Purchase History
We collect this data history from publicly available records. To have your information removed, we recommend requesting removal directly through your county’s website.
| Date | Buyer | Sale Price | Title Company |
|---|---|---|---|
| Munoz Jesus M | -- | Grand Canyon Title Agency | |
| Munoz Jesse M | -- | First Southwestern Title | |
| Nationsbanc Mtg Corp | -- | Security Title Agency | |
| Hendon Carl | -- | -- | |
| Nolte Steve | $58,487 | Chicago Title Insurance Co |
Source: Public Records
Mortgage History
We collect this data history from publicly available records. To have your information removed, we recommend requesting removal directly through your county’s website.
| Date | Status | Borrower | Loan Amount |
|---|---|---|---|
| Open | Munoz Jesus M | $101,500 | |
| Closed | Munoz Jesse M | $84,678 |
Source: Public Records
Tax History
| Year | Tax Paid | Tax Assessment Tax Assessment Total Assessment is a certain percentage of the fair market value that is determined by local assessors to be the total taxable value of land and additions on the property. | Land | Improvement |
|---|---|---|---|---|
| 2025 | $1,498 | $18,033 | -- | -- |
| 2024 | $1,514 | $17,174 | -- | -- |
| 2023 | $1,514 | $30,470 | $6,090 | $24,380 |
| 2022 | $1,481 | $23,650 | $4,730 | $18,920 |
| 2021 | $1,521 | $20,370 | $4,070 | $16,300 |
| 2020 | $1,501 | $19,900 | $3,980 | $15,920 |
| 2019 | $656 | $15,130 | $3,020 | $12,110 |
| 2018 | $626 | $12,530 | $2,500 | $10,030 |
| 2017 | $606 | $11,720 | $2,340 | $9,380 |
| 2016 | $595 | $10,170 | $2,030 | $8,140 |
| 2015 | $562 | $9,350 | $1,870 | $7,480 |
Source: Public Records
Map
Nearby Homes
- 332 N Dobson Rd Unit 22
- 2137 W 1st Place
- 1904 W 3rd St
- 2727 E University Dr Unit 60
- 2727 E University Dr Unit 62
- 2727 E University Dr Unit 19
- 2727 E University Dr Unit 144
- 2727 E University Dr Unit 55
- 2727 E University Dr Unit 141
- 2727 E University Dr Unit 70
- 2727 E University Dr Unit 114
- 2727 E University Dr Unit 91
- 2727 E University Dr Unit 120
- 2727 E University Dr Unit 4
- 2220 W Dora St Unit 114
- 2223 W Dora St
- 451 N San Jose Cir
- 525 N May Unit 22
- 2673 E Oakleaf Dr
- 2692 E Silk Oak Dr
- 2027 W 2nd Place
- 2037 W 2nd Place
- 2028 W 2nd St
- 2036 W 2nd St
- 2022 W 2nd St
- 2025 W 2nd Place
- 2043 W 2nd Place
- 2042 W 2nd St
- 2038 W 2nd Place
- 234 N Dobson Rd Unit 4
- 226 N Dobson Rd
- 2047 W 2nd Place
- 2023 W 2nd Place
- 2050 W 2nd St
- 214 N Dobson Rd
- 2046 W 2nd Place
- 2027 W 2nd St
- 2035 W 2nd St
- 2021 W 2nd St
- 2057 W 2nd Place
Your Personal Tour Guide
Ask me questions while you tour the home.