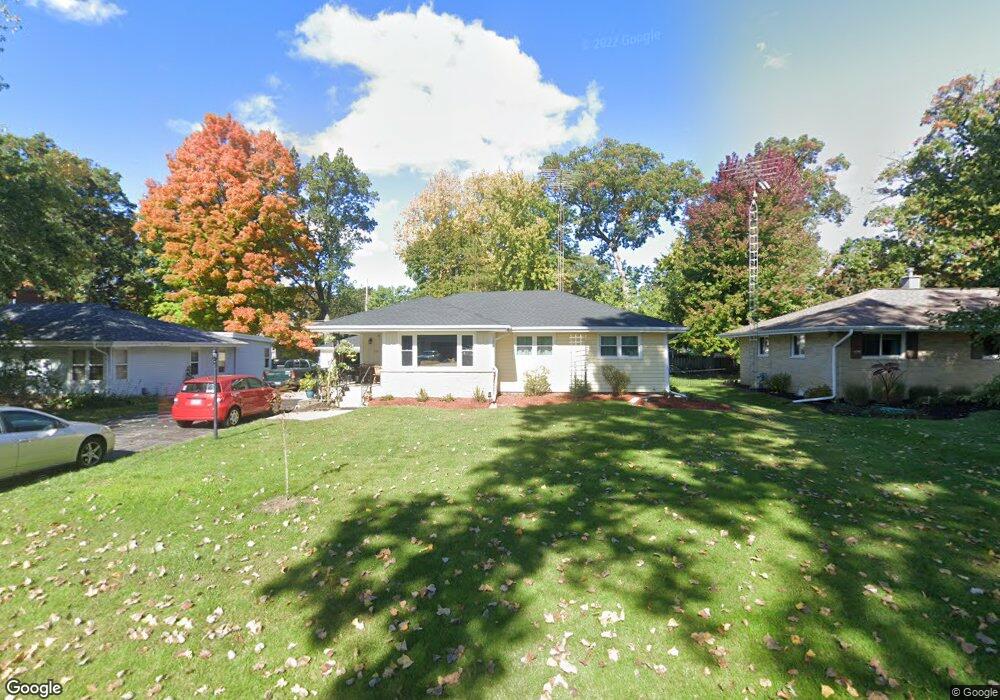
204 E Elm St Silver Lake, WI 53170
Estimated Value: $287,369 - $301,000
3
Beds
1
Bath
1,239
Sq Ft
$235/Sq Ft
Est. Value
About This Home
This home is located at 204 E Elm St, Silver Lake, WI 53170 and is currently estimated at $291,592, approximately $235 per square foot. 204 E Elm St is a home located in Kenosha County with nearby schools including Riverview Elementary School and Wilmot High School.
Ownership History
Date
Name
Owned For
Owner Type
Purchase Details
Closed on
Sep 3, 2019
Sold by
Mondragon Maria L
Bought by
Mondragon Maria L and Mondragon Trust
Current Estimated Value
Purchase Details
Closed on
Jul 21, 2010
Sold by
Anderson Walter J
Bought by
Federal National Mortgage Association
Purchase Details
Closed on
Aug 14, 2006
Sold by
Rudolph John R
Bought by
Anderson Walter J
Home Financials for this Owner
Home Financials are based on the most recent Mortgage that was taken out on this home.
Original Mortgage
$165,900
Interest Rate
6.78%
Mortgage Type
New Conventional
Create a Home Valuation Report for This Property
The Home Valuation Report is an in-depth analysis detailing your home's value as well as a comparison with similar homes in the area
Home Values in the Area
Average Home Value in this Area
Purchase History
We collect this data history from publicly available records. To have your information removed, we recommend requesting removal directly through your county’s website.
| Date | Buyer | Sale Price | Title Company |
|---|---|---|---|
| Mondragon Maria L | -- | None Available | |
| Federal National Mortgage Association | $207,100 | -- | |
| Anderson Walter J | $165,900 | None Available |
Source: Public Records
Mortgage History
We collect this data history from publicly available records. To have your information removed, we recommend requesting removal directly through your county’s website.
| Date | Status | Borrower | Loan Amount |
|---|---|---|---|
| Previous Owner | Anderson Walter J | $165,900 |
Source: Public Records
Tax History
| Year | Tax Paid | Tax Assessment Tax Assessment Total Assessment is a certain percentage of the fair market value that is determined by local assessors to be the total taxable value of land and additions on the property. | Land | Improvement |
|---|---|---|---|---|
| 2025 | $3,628 | $264,700 | $46,300 | $218,400 |
| 2024 | $2,935 | $214,700 | $37,300 | $177,400 |
| 2023 | $2,698 | $214,700 | $37,300 | $177,400 |
| 2022 | $2,936 | $175,500 | $33,900 | $141,600 |
| 2021 | $2,910 | $175,500 | $33,900 | $141,600 |
| 2020 | $2,922 | $154,100 | $32,200 | $121,900 |
| 2019 | $2,797 | $154,100 | $32,200 | $121,900 |
| 2018 | $2,751 | $127,500 | $25,500 | $102,000 |
| 2017 | $3,170 | $127,500 | $25,500 | $102,000 |
| 2016 | $3,147 | $127,500 | $25,500 | $102,000 |
| 2015 | $3,162 | $155,600 | $36,100 | $119,500 |
| 2014 | $3,399 | $155,600 | $36,100 | $119,500 |
Source: Public Records
Map
Nearby Homes
- 622 S 4th St
- 114 E Spruce St
- 110 E Wisconsin Ave
- 209 E Chestnut St
- 629 S Cogswell Dr
- 606 S Cogswell Dr
- 416 S Cogswell Dr Unit 40
- 416 S Cogswell Dr Unit 19
- 202 E Park St
- 113 S 1st St
- 317 E Lake St
- 300 E Lake St
- 325 W Park St
- 209 N 2nd St
- 536 N Cogswell Dr Unit 6
- 905 Lakeview Dr
- 788 N Cogswell Dr
- 1215 Pryor St
- 8200 312th Ave
- LT14 276th Ave
Your Personal Tour Guide
Ask me questions while you tour the home.