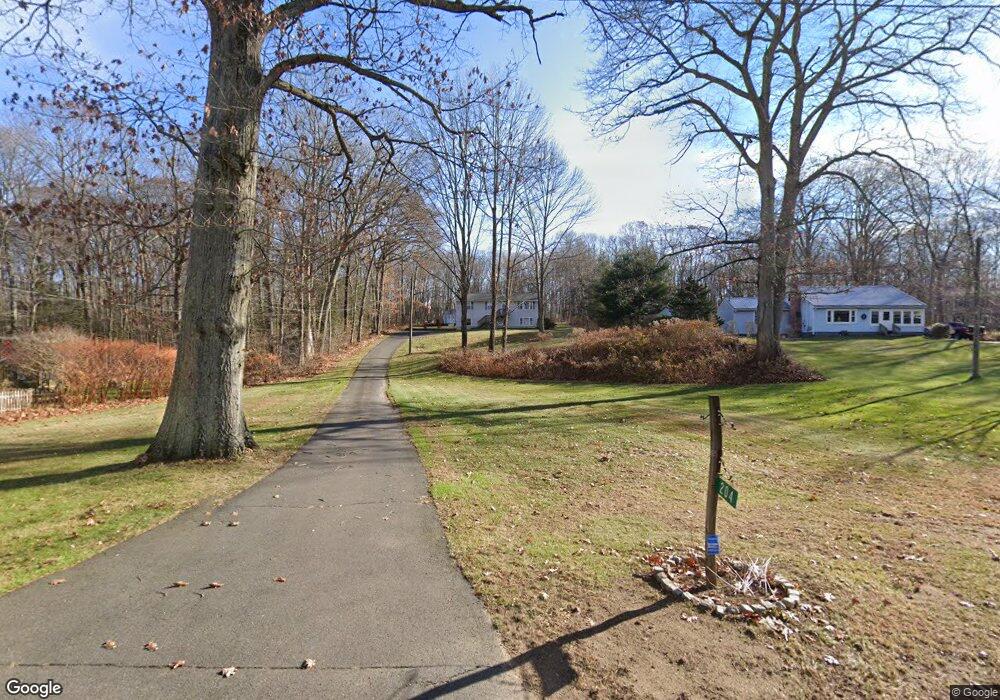
204 Root Rd Coventry, CT 06238
Estimated Value: $320,000 - $361,886
3
Beds
2
Baths
1,104
Sq Ft
$310/Sq Ft
Est. Value
About This Home
This home is located at 204 Root Rd, Coventry, CT 06238 and is currently estimated at $342,472, approximately $310 per square foot. 204 Root Rd is a home located in Tolland County with nearby schools including George Hersey Robertson School, Coventry Grammar School, and Capt. Nathan Hale School.
Ownership History
Date
Name
Owned For
Owner Type
Purchase Details
Closed on
Apr 26, 1999
Sold by
Hm Frenchette Re
Bought by
Martin Danny and Martin Joann
Current Estimated Value
Purchase Details
Closed on
Nov 23, 1998
Sold by
Saunders Marjorie
Bought by
Hm Trendette Real Est
Create a Home Valuation Report for This Property
The Home Valuation Report is an in-depth analysis detailing your home's value as well as a comparison with similar homes in the area
Home Values in the Area
Average Home Value in this Area
Purchase History
| Date | Buyer | Sale Price | Title Company |
|---|---|---|---|
| Martin Danny | $119,000 | -- | |
| Hm Trendette Real Est | $30,000 | -- | |
| Martin Danny | $119,000 | -- | |
| Hm Trendette Real Est | $30,000 | -- |
Source: Public Records
Mortgage History
| Date | Status | Borrower | Loan Amount |
|---|---|---|---|
| Open | Hm Trendette Real Est | $139,135 | |
| Closed | Hm Trendette Real Est | $22,500 |
Source: Public Records
Tax History
| Year | Tax Paid | Tax Assessment Tax Assessment Total Assessment is a certain percentage of the fair market value that is determined by local assessors to be the total taxable value of land and additions on the property. | Land | Improvement |
|---|---|---|---|---|
| 2025 | $5,047 | $212,400 | $57,400 | $155,000 |
| 2024 | $4,327 | $129,900 | $47,400 | $82,500 |
| 2023 | $4,123 | $129,900 | $47,400 | $82,500 |
| 2022 | $4,046 | $129,900 | $47,400 | $82,500 |
| 2021 | $4,046 | $129,900 | $47,400 | $82,500 |
| 2020 | $4,049 | $129,900 | $47,400 | $82,500 |
| 2019 | $4,180 | $129,800 | $47,400 | $82,400 |
| 2018 | $4,086 | $126,900 | $47,400 | $79,500 |
| 2017 | $4,061 | $126,900 | $47,400 | $79,500 |
| 2016 | $3,959 | $126,900 | $47,400 | $79,500 |
| 2015 | $3,959 | $126,900 | $47,400 | $79,500 |
| 2014 | $4,142 | $145,500 | $57,800 | $87,700 |
Source: Public Records
Map
Nearby Homes
- 498 Root Rd
- 0 Woodland Rd
- 55 Whites Hill Rd
- 316 Shore Dr
- 198 Forest Rd
- 97 Armstrong Rd
- 152 Cheney Ln
- 550 High St
- 1091 Flanders Rd
- 0 Daly Rd Unit 24146464
- 2478 Main St
- 27 Fox Trail
- 17 Ireland Dr
- 149 Hillyndale Rd
- 0 Seneca Trail
- 0 Hinkel Mae Dr
- 31 Wyllys Farm Rd
- 103 S Street Extension
- 106 S Street Extension
- 37 Wyllys Farm Rd
Your Personal Tour Guide
Ask me questions while you tour the home.