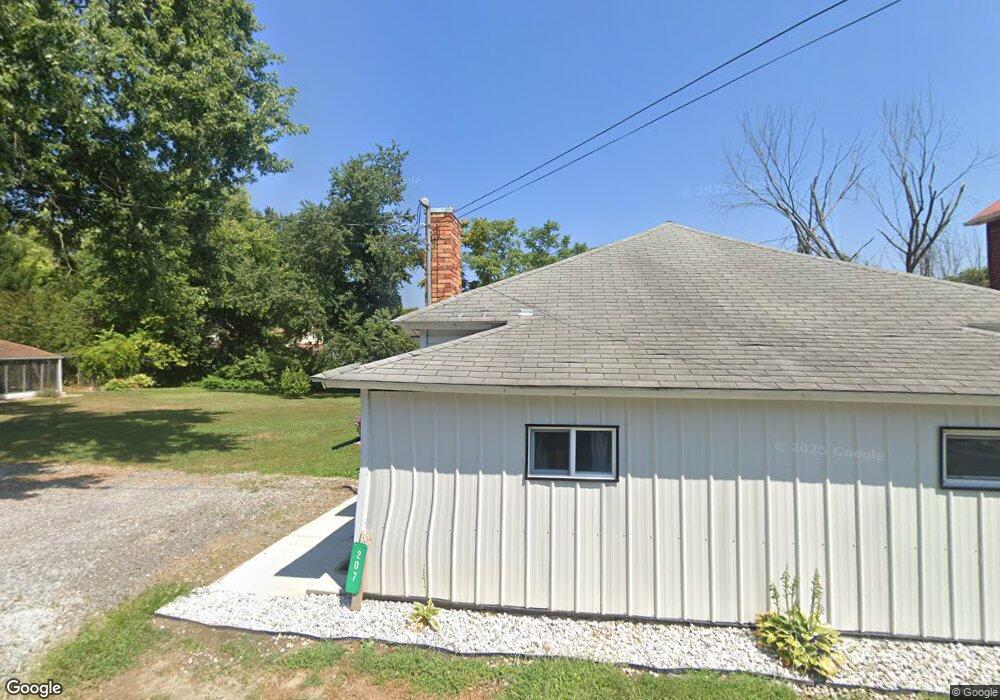
205 Cherry Way Mc Grann, PA 16236
Estimated Value: $57,000 - $73,000
1
Bed
1
Bath
720
Sq Ft
$91/Sq Ft
Est. Value
About This Home
This home is located at 205 Cherry Way, Mc Grann, PA 16236 and is currently estimated at $65,376, approximately $90 per square foot. 205 Cherry Way is a home with nearby schools including Lenape Elementary School, Grace Christian School, and Harvest Christian School.
Ownership History
Date
Name
Owned For
Owner Type
Purchase Details
Closed on
Aug 20, 2021
Sold by
Check Richard D and Check Margaret R
Bought by
Haney Joseph W and Goldinger Kaitlyn A
Current Estimated Value
Home Financials for this Owner
Home Financials are based on the most recent Mortgage that was taken out on this home.
Original Mortgage
$50,000
Outstanding Balance
$45,187
Interest Rate
2.5%
Mortgage Type
New Conventional
Estimated Equity
$20,189
Purchase Details
Closed on
May 6, 1998
Bought by
Check Richard D and Check Margart R
Create a Home Valuation Report for This Property
The Home Valuation Report is an in-depth analysis detailing your home's value as well as a comparison with similar homes in the area
Home Values in the Area
Average Home Value in this Area
Purchase History
| Date | Buyer | Sale Price | Title Company |
|---|---|---|---|
| Haney Joseph W | $50,000 | None Available | |
| Check Richard D | $17,000 | -- |
Source: Public Records
Mortgage History
| Date | Status | Borrower | Loan Amount |
|---|---|---|---|
| Open | Haney Joseph W | $50,000 |
Source: Public Records
Tax History
| Year | Tax Paid | Tax Assessment Tax Assessment Total Assessment is a certain percentage of the fair market value that is determined by local assessors to be the total taxable value of land and additions on the property. | Land | Improvement |
|---|---|---|---|---|
| 2025 | $1,174 | $12,910 | $8,710 | $4,200 |
| 2024 | $1,084 | $12,910 | $8,710 | $4,200 |
| 2023 | $1,045 | $12,910 | $8,710 | $4,200 |
| 2022 | $1,045 | $12,910 | $8,710 | $4,200 |
| 2021 | $1,045 | $12,910 | $8,710 | $4,200 |
| 2020 | $1,045 | $12,910 | $8,710 | $4,200 |
| 2019 | $1,045 | $12,910 | $8,710 | $4,200 |
| 2018 | $1,044 | $12,445 | $6,445 | $6,000 |
| 2017 | $1,036 | $12,910 | $8,710 | $4,200 |
| 2016 | $1,036 | $12,910 | $8,710 | $4,200 |
| 2015 | $932 | $12,910 | $8,710 | $4,200 |
| 2014 | $932 | $12,910 | $8,710 | $4,200 |
Source: Public Records
Map
Nearby Homes
Your Personal Tour Guide
Ask me questions while you tour the home.