Estimated Value: $146,000 - $176,000
4
Beds
2
Baths
1,752
Sq Ft
$89/Sq Ft
Est. Value
About This Home
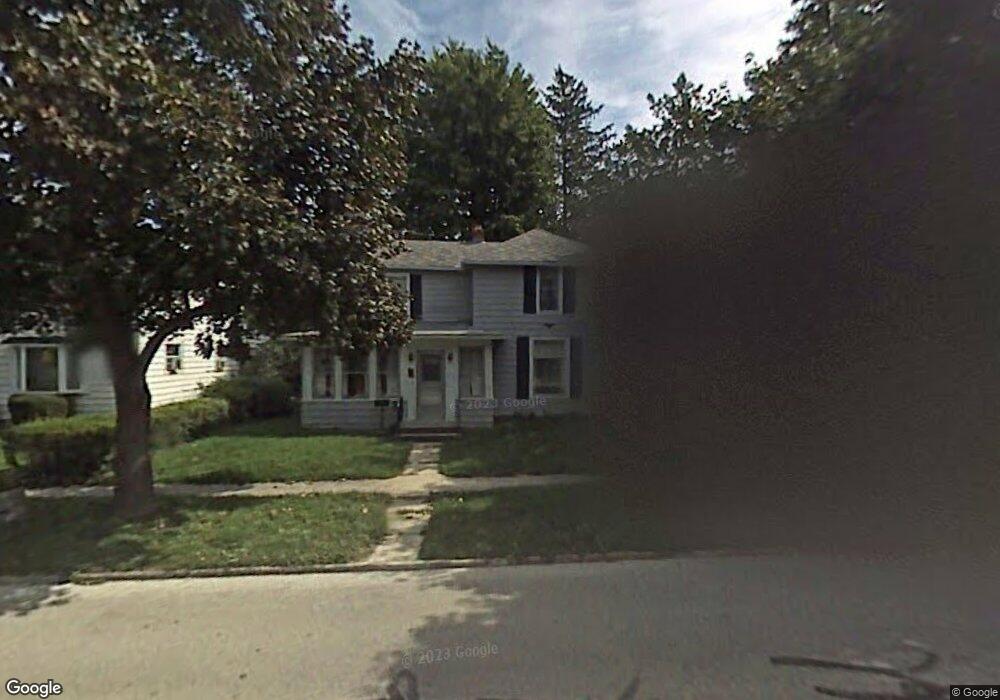
This home is located at 205 Main St, Genoa, OH 43430 and is currently estimated at $156,803, approximately $89 per square foot. 205 Main St is a home located in Ottawa County with nearby schools including Genoa Elementary School and Community Christian Academy.
Ownership History
Date
Name
Owned For
Owner Type
Purchase Details
Closed on
Nov 7, 2011
Sold by
Champion Paul H
Bought by
Champion David L and Champsion Margaret L
Current Estimated Value
Home Financials for this Owner
Home Financials are based on the most recent Mortgage that was taken out on this home.
Original Mortgage
$68,000
Outstanding Balance
$3,468
Interest Rate
3.97%
Mortgage Type
New Conventional
Estimated Equity
$153,335
Purchase Details
Closed on
Sep 23, 2002
Sold by
Trst Gene Graves
Bought by
Harmeyer Richard G and Harmeyer Lenore A
Home Financials for this Owner
Home Financials are based on the most recent Mortgage that was taken out on this home.
Original Mortgage
$42,566
Interest Rate
6.4%
Mortgage Type
New Conventional
Purchase Details
Closed on
Nov 19, 1996
Sold by
Peters Robert S
Bought by
Knott Rose M
Home Financials for this Owner
Home Financials are based on the most recent Mortgage that was taken out on this home.
Original Mortgage
$10,000
Interest Rate
8.18%
Mortgage Type
New Conventional
Create a Home Valuation Report for This Property
The Home Valuation Report is an in-depth analysis detailing your home's value as well as a comparison with similar homes in the area
Purchase History
| Date | Buyer | Sale Price | Title Company |
|---|---|---|---|
| Champion David L | $26,100 | Attorney | |
| Harmeyer Richard G | $63,950 | -- | |
| Knott Rose M | $29,000 | -- |
Source: Public Records
Mortgage History
| Date | Status | Borrower | Loan Amount |
|---|---|---|---|
| Open | Champion David L | $68,000 | |
| Previous Owner | Harmeyer Richard G | $42,566 | |
| Previous Owner | Knott Rose M | $10,000 |
Source: Public Records
Tax History
| Year | Tax Paid | Tax Assessment Tax Assessment Total Assessment is a certain percentage of the fair market value that is determined by local assessors to be the total taxable value of land and additions on the property. | Land | Improvement |
|---|---|---|---|---|
| 2025 | $1,661 | $33,184 | $8,523 | $24,661 |
| 2024 | $1,661 | $33,184 | $8,523 | $24,661 |
| 2023 | $1,496 | $23,737 | $7,105 | $16,632 |
| 2022 | $1,198 | $23,737 | $7,105 | $16,632 |
| 2021 | $1,065 | $23,740 | $7,110 | $16,630 |
| 2020 | $887 | $18,760 | $4,900 | $13,860 |
| 2019 | $884 | $18,760 | $4,900 | $13,860 |
| 2018 | $861 | $18,760 | $4,900 | $13,860 |
| 2017 | $869 | $17,180 | $4,900 | $12,280 |
| 2016 | $872 | $17,180 | $4,900 | $12,280 |
| 2015 | $858 | $17,180 | $4,900 | $12,280 |
| 2014 | $716 | $15,490 | $4,900 | $10,590 |
| 2013 | $716 | $15,490 | $4,900 | $10,590 |
Source: Public Records
Map
Nearby Homes
- 304 Main St
- 207 E 11th St
- 416 Castle Cove
- 1216 Main St
- 21682 State Route 51 W
- 1320 Superior St
- 22899 W Hellwig Rd
- 0 Recker Rd
- 23526 W Manor Dr
- 330 5th St
- 19079 W Orchard Dr
- 26810 Woodland Ct
- 26931 W Woodland Ct
- 211 Lime St
- 1001 Oak St
- 1005 W College Ave
- 812 W College Ave
- 620 Water St
- 913 W College Ave
- 510 Water St
Your Personal Tour Guide
Ask me questions while you tour the home.