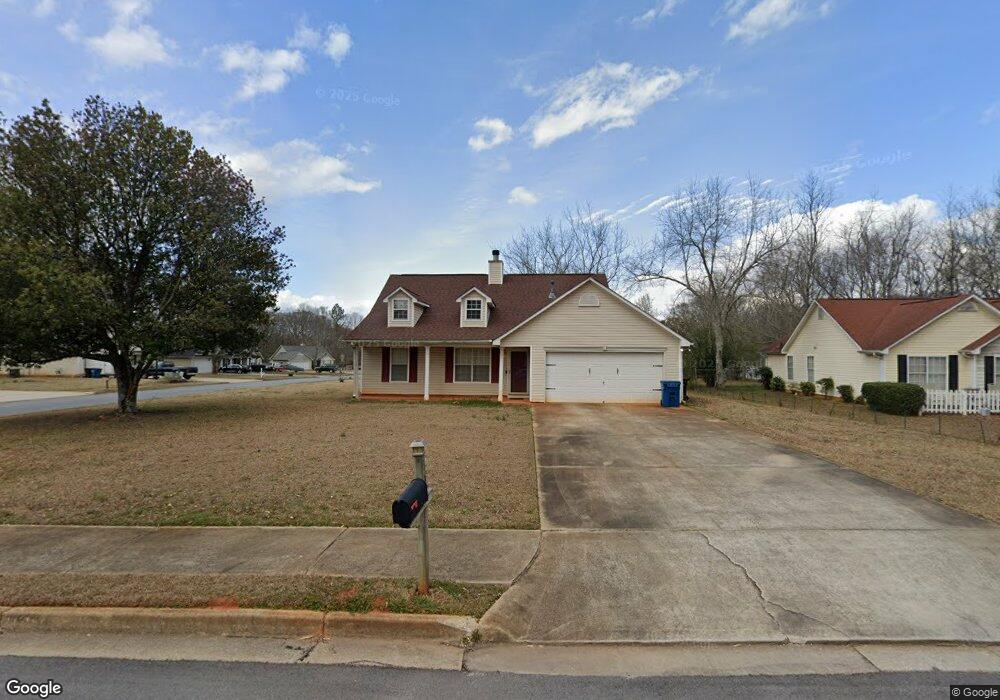
205 Talbot Ct McDonough, GA 30253
Estimated Value: $210,000 - $239,000
3
Beds
2
Baths
1,223
Sq Ft
$188/Sq Ft
Est. Value
About This Home
This home is located at 205 Talbot Ct, McDonough, GA 30253 and is currently estimated at $229,603, approximately $187 per square foot. 205 Talbot Ct is a home located in Henry County with nearby schools including Tussahaw Elementary School, McDonough Middle School, and McDonough Methodist Academy.
Ownership History
Date
Name
Owned For
Owner Type
Purchase Details
Closed on
Nov 17, 2023
Sold by
Green Yvetta D
Bought by
Green Yvetta
Current Estimated Value
Home Financials for this Owner
Home Financials are based on the most recent Mortgage that was taken out on this home.
Original Mortgage
$61,050
Outstanding Balance
$60,011
Interest Rate
7.63%
Mortgage Type
FHA
Estimated Equity
$169,592
Purchase Details
Closed on
May 2, 2000
Sold by
Tim Jones Communities Inc
Bought by
Green Yvetta D
Home Financials for this Owner
Home Financials are based on the most recent Mortgage that was taken out on this home.
Original Mortgage
$17,380
Interest Rate
8.28%
Mortgage Type
New Conventional
Create a Home Valuation Report for This Property
The Home Valuation Report is an in-depth analysis detailing your home's value as well as a comparison with similar homes in the area
Home Values in the Area
Average Home Value in this Area
Purchase History
| Date | Buyer | Sale Price | Title Company |
|---|---|---|---|
| Green Yvetta | -- | -- | |
| Green Yvetta D | $89,700 | -- |
Source: Public Records
Mortgage History
| Date | Status | Borrower | Loan Amount |
|---|---|---|---|
| Open | Green Yvetta | $61,050 | |
| Previous Owner | Green Yvetta D | $17,380 |
Source: Public Records
Tax History
| Year | Tax Paid | Tax Assessment Tax Assessment Total Assessment is a certain percentage of the fair market value that is determined by local assessors to be the total taxable value of land and additions on the property. | Land | Improvement |
|---|---|---|---|---|
| 2025 | $2,988 | $103,920 | $12,000 | $91,920 |
| 2024 | $2,988 | $94,000 | $12,000 | $82,000 |
| 2023 | $1,773 | $97,560 | $11,200 | $86,360 |
| 2022 | $2,138 | $67,800 | $10,000 | $57,800 |
| 2021 | $1,766 | $52,520 | $10,000 | $42,520 |
| 2020 | $1,715 | $50,280 | $8,000 | $42,280 |
| 2019 | $1,713 | $49,000 | $8,000 | $41,000 |
| 2018 | $1,330 | $38,120 | $8,000 | $30,120 |
| 2016 | $1,212 | $34,760 | $6,000 | $28,760 |
| 2015 | $1,045 | $29,880 | $6,000 | $23,880 |
| 2014 | $791 | $24,200 | $6,000 | $18,200 |
Source: Public Records
Map
Nearby Homes
Your Personal Tour Guide
Ask me questions while you tour the home.