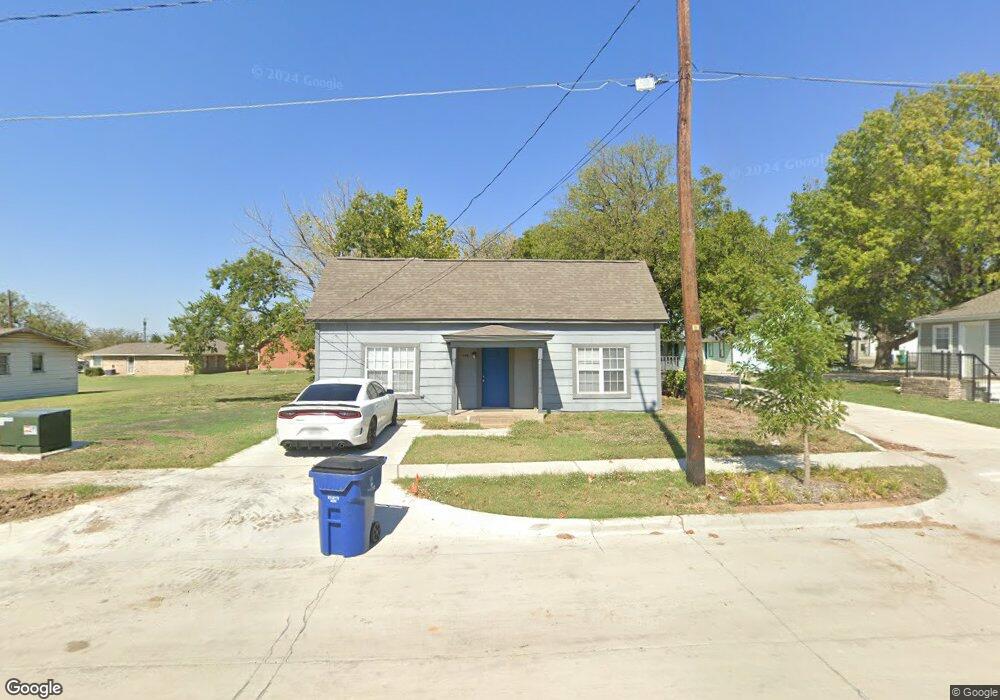
205 W Beech St Celina, TX 75009
Estimated Value: $257,127 - $371,000
3
Beds
1
Bath
1,263
Sq Ft
$242/Sq Ft
Est. Value
About This Home
This home is located at 205 W Beech St, Celina, TX 75009 and is currently estimated at $306,032, approximately $242 per square foot. 205 W Beech St is a home located in Collin County with nearby schools including Celina Primary School, Moore Middle School, and Celina High School.
Ownership History
Date
Name
Owned For
Owner Type
Purchase Details
Closed on
Feb 13, 2026
Sold by
Unruh Randall and Woodcox-Unruh Shelly E
Bought by
Morales Rafael
Current Estimated Value
Home Financials for this Owner
Home Financials are based on the most recent Mortgage that was taken out on this home.
Original Mortgage
$276,600
Outstanding Balance
$276,330
Interest Rate
6.11%
Mortgage Type
Seller Take Back
Estimated Equity
$29,702
Purchase Details
Closed on
Sep 28, 2007
Sold by
The Cit Group/Consumer Finance Inc
Bought by
Unruh Randall L and Woodcox Unruh Shelly E
Purchase Details
Closed on
Aug 7, 2007
Sold by
Keel Tammy and Keel Doug
Bought by
The Cit Group/Consumer Finance Inc
Purchase Details
Closed on
Mar 27, 2001
Sold by
Upchurch Robin Elizabeth
Bought by
Keel Doug and Keel Tammy
Home Financials for this Owner
Home Financials are based on the most recent Mortgage that was taken out on this home.
Original Mortgage
$25,000
Interest Rate
6.98%
Mortgage Type
Seller Take Back
Create a Home Valuation Report for This Property
The Home Valuation Report is an in-depth analysis detailing your home's value as well as a comparison with similar homes in the area
Home Values in the Area
Average Home Value in this Area
Purchase History
| Date | Buyer | Sale Price | Title Company |
|---|---|---|---|
| Morales Rafael | -- | None Listed On Document | |
| Unruh Randall L | -- | None Available | |
| The Cit Group/Consumer Finance Inc | $68,348 | None Available | |
| Keel Doug | -- | -- |
Source: Public Records
Mortgage History
| Date | Status | Borrower | Loan Amount |
|---|---|---|---|
| Open | Morales Rafael | $276,600 | |
| Previous Owner | Keel Doug | $25,000 |
Source: Public Records
Tax History
| Year | Tax Paid | Tax Assessment Tax Assessment Total Assessment is a certain percentage of the fair market value that is determined by local assessors to be the total taxable value of land and additions on the property. | Land | Improvement |
|---|---|---|---|---|
| 2025 | $5,022 | $249,120 | $180,000 | $79,475 |
| 2024 | $4,286 | $207,600 | $150,000 | $66,164 |
| 2023 | $4,286 | $173,000 | $120,000 | $53,000 |
| 2022 | $3,696 | $161,277 | $50,000 | $111,277 |
| 2021 | $2,429 | $104,000 | $20,000 | $84,000 |
| 2020 | $1,498 | $61,153 | $20,000 | $41,153 |
| 2019 | $1,553 | $60,968 | $20,000 | $40,968 |
| 2018 | $1,717 | $67,152 | $20,000 | $47,152 |
| 2017 | $1,816 | $71,000 | $20,000 | $51,000 |
| 2016 | $1,287 | $50,000 | $8,500 | $41,500 |
| 2015 | $982 | $42,513 | $8,500 | $34,013 |
Source: Public Records
Map
Nearby Homes
- 305 N Arizona Dr
- 407 W Maple St
- Lot 2 Louisiana
- Lot 1 Louisiana
- 220 Chestnut St
- 216 Chestnut St
- 300 Chestnut St
- 212 E Walnut St
- 212 N Arizona Dr
- 316 Chestnut St
- 324 Chestnut St
- 332 Chestnut St
- 336 Chestnut St
- 309 Chestnut St
- 101 Chestnut St
- 317 Chestnut St
- 311 N Illinois St
- 403 E Pecan St
- 406 E Maple St
- 410 N Texas St
- 207 W Beech St
- 302 N Louisiana Dr
- 306 N Louisiana Dr
- 308 N Louisiana Dr
- 206 W Beech St
- 307 N Ohio St Unit 309
- 212 N Louisiana Dr
- 208 W Beech St
- 211 N Ohio St
- 211 N Ohio St Unit 7
- 211 S Ohio St
- 312 N Louisiana Dr
- 302 N Ohio St
- 303 W Beech St
- 212 N Ohio St
- 212 N Ohio St
- 308 N Ohio St
- 212 N Ohio Dr
- 239 W Pecan St
- 206 N Ohio St
Your Personal Tour Guide
Ask me questions while you tour the home.