206 S High St Springport, IN 47386
Estimated Value: $203,000 - $392,846
About This Home
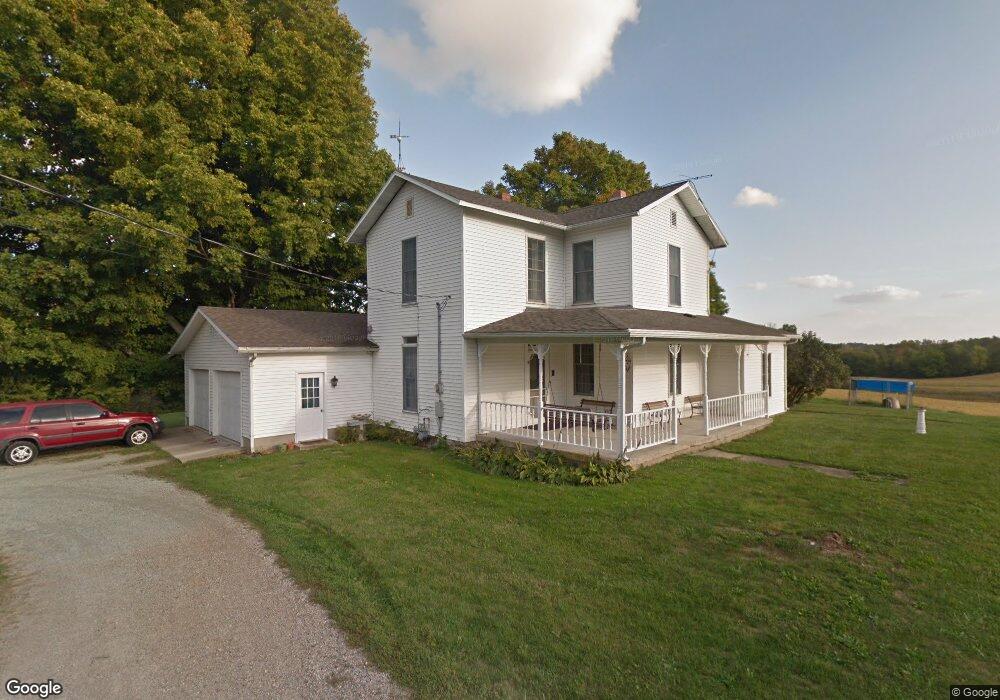
This home is located at 206 S High St, Springport, IN 47386 and is currently estimated at $325,949, approximately $104 per square foot. 206 S High St is a home located in Henry County with nearby schools including Blue River Valley Elementary School and Blue River Valley Junior/Senior High School.
Ownership History
We collect this data history from publicly available records. To have your information removed, we recommend requesting removal directly through your county’s website.
Purchase Details
Home Financials for this Owner
Home Financials are based on the most recent Mortgage that was taken out on this home.Purchase History
We collect this data history from publicly available records. To have your information removed, we recommend requesting removal directly through your county’s website.
| Date | Buyer | Sale Price | Title Company |
|---|---|---|---|
| -- | Fidelity National Ttl Co Llc | ||
| -- | Fidelity National Ttl Co Llc | ||
| -- | Fidelity National Ttl Co Llc |
Mortgage History
We collect this data history from publicly available records. To have your information removed, we recommend requesting removal directly through your county’s website.
| Date | Status | Borrower | Loan Amount |
|---|---|---|---|
| Open | $179,100 |
Tax History
We collect this data history from publicly available records. To have your information removed, we recommend requesting removal directly through your county’s website.
| Year | Tax Paid | Tax Assessment Tax Assessment Total Assessment is a certain percentage of the fair market value that is determined by local assessors to be the total taxable value of land and additions on the property. | Land | Improvement |
|---|---|---|---|---|
| 2025 | $2,407 | $210,200 | $47,200 | $163,000 |
| 2024 | $2,286 | $201,200 | $49,100 | $152,100 |
| 2023 | $2,076 | $178,500 | $44,700 | $133,800 |
| 2022 | $2,040 | $166,000 | $35,400 | $130,600 |
| 2021 | $1,703 | $141,800 | $33,000 | $108,800 |
| 2020 | $2,020 | $138,500 | $32,900 | $105,600 |
| 2019 | $2,533 | $160,000 | $56,800 | $103,200 |
| 2018 | $2,462 | $158,000 | $56,400 | $101,600 |
| 2017 | $2,072 | $163,300 | $62,400 | $100,900 |
| 2016 | $2,043 | $163,100 | $64,600 | $98,500 |
| 2014 | $1,803 | $148,700 | $66,300 | $82,400 |
| 2013 | $1,803 | $140,000 | $59,600 | $80,400 |
Map
- 7398 N Prairie Rd
- 7122 N Prairie Rd
- 71 E Wildwood Dr
- 0 NW Corner of 950 N & Prairie Unit 202623643
- 7885 N County Road 100 E
- 9029 N State Road 3
- 1076 E County Road 650 N
- 9738 N Ammerman Dr
- 12501 Saddlebrook Dr
- 1990 E County Road 600 N
- 206 W School St
- 601 S Walnut St
- 107 N Meridian St
- 204 Spring St
- 303 Spring St
- 206 W Main St
- 4043 N County Road 100 E
- 3793 W US Highway 36
- 3052 N Gary St Unit 136
- 3052 N Gary St Unit 15
Ask me questions while you tour the home.