20635 Sibbald Square Ashburn, VA 20147
Estimated Value: $555,000 - $589,000
About This Home
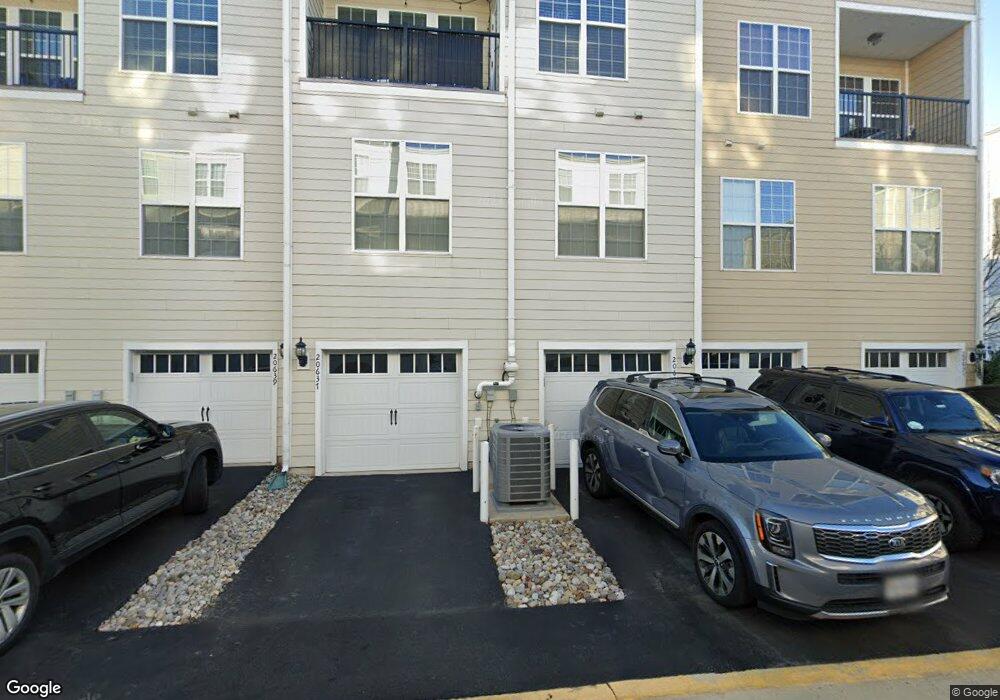
This home is located at 20635 Sibbald Square, Ashburn, VA 20147 and is currently estimated at $566,764, approximately $216 per square foot. 20635 Sibbald Square is a home located in Loudoun County with nearby schools including Belmont Station Elementary School, Trailside Middle School, and Stone Bridge High.
Ownership History
We collect this data history from publicly available records. To have your information removed, we recommend requesting removal directly through your county’s website.
Purchase Details
Home Financials for this Owner
Home Financials are based on the most recent Mortgage that was taken out on this home.Home Values in the Area
Average Home Value in this Area
Purchase History
We collect this data history from publicly available records. To have your information removed, we recommend requesting removal directly through your county’s website.
| Date | Buyer | Sale Price | Title Company |
|---|---|---|---|
| $309,600 | -- |
Mortgage History
We collect this data history from publicly available records. To have your information removed, we recommend requesting removal directly through your county’s website.
| Date | Status | Borrower | Loan Amount |
|---|---|---|---|
| Open | $301,751 |
Tax History
We collect this data history from publicly available records. To have your information removed, we recommend requesting removal directly through your county’s website.
| Year | Tax Paid | Tax Assessment Tax Assessment Total Assessment is a certain percentage of the fair market value that is determined by local assessors to be the total taxable value of land and additions on the property. | Land | Improvement |
|---|---|---|---|---|
| 2025 | $4,186 | $520,050 | $170,000 | $350,050 |
| 2024 | $4,584 | $529,950 | $170,000 | $359,950 |
| 2023 | $4,330 | $494,880 | $170,000 | $324,880 |
| 2022 | $3,959 | $444,880 | $120,000 | $324,880 |
| 2021 | $3,912 | $399,160 | $90,000 | $309,160 |
| 2020 | $3,994 | $385,910 | $90,000 | $295,910 |
| 2019 | $3,953 | $378,240 | $80,000 | $298,240 |
| 2018 | $3,902 | $359,600 | $80,000 | $279,600 |
| 2017 | $3,967 | $352,610 | $80,000 | $272,610 |
| 2016 | $4,064 | $354,940 | $0 | $0 |
| 2015 | $4,214 | $291,250 | $0 | $291,250 |
| 2014 | $4,019 | $267,950 | $0 | $267,950 |
Map
- 20640 Sibbald Square
- 20659 Sibbald Square
- 42831 Burrell Square
- 42746 Tunstall Terrace
- 20655 Tannahill Terrace
- 42703 Tunstall Terrace
- 20696 Erskine Terrace
- 20718 Erskine Terrace
- 20697 Erskine Terrace
- 20775 Lamlash Terrace
- 42632 Darala Dr
- 42716 Darala Dr
- 42635 Darala Dr
- 42639 Darala Dr
- 42643 Darala Dr
- 42645 Darala Dr
- 42641 Darala Dr
- 42657 Darala Dr
- 42661 Darala Dr
- 42663 Darala Dr
- 20656 Sibbald Square
- 20658 Sibbald Square Unit 1422
- 20658 Sibbald Square
- 20658 Sibbald Square Unit 222
- 20654 Sibbald Square
- 20660 Sibbald Square Unit 1422
- 20660 Sibbald Square Unit 1-A
- 20652 Sibbald Square
- 20650 Sibbald Square
- 20648 Sibbald Square
- 20648 Sibbald Square Unit 722
- 20646 Sibbald Square
- 20646 Sibbald Square Unit 1H
- 20644 Sibbald Square
- 20655 Sibbald Square
- 20642 Sibbald Square
- 20634 Sibbald Square Unit 1422
- 20634 Sibbald Square Unit 1122
- 20634 Sibbald Square
- 20632 Sibbald Square
Ask me questions while you tour the home.