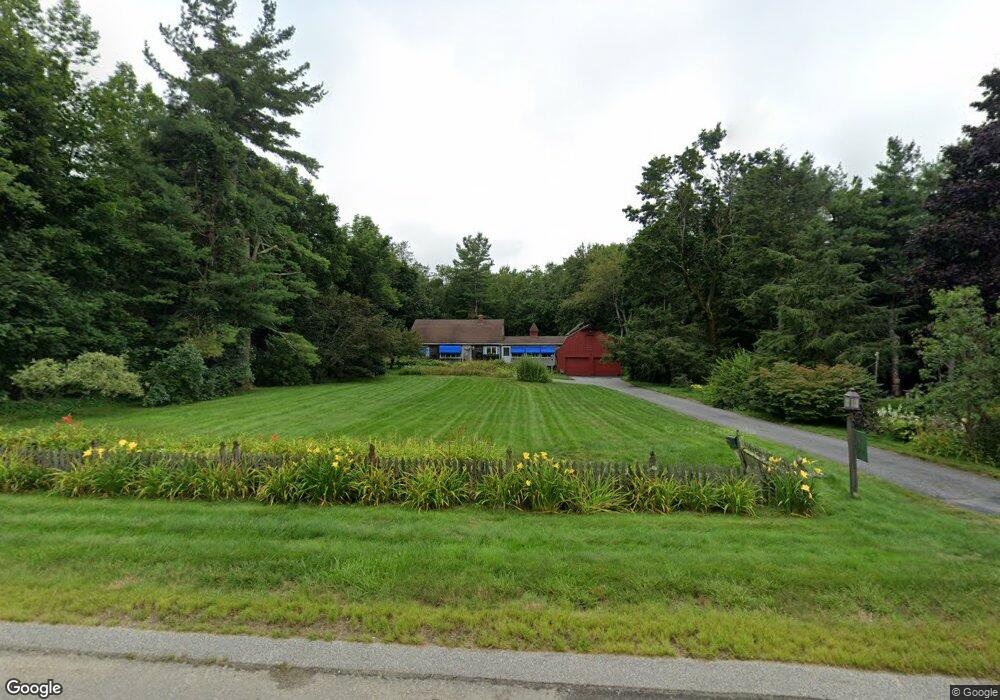
207 Grove St Paxton, MA 01612
Estimated Value: $372,000 - $633,000
4
Beds
2
Baths
1,945
Sq Ft
$266/Sq Ft
Est. Value
About This Home
This home is located at 207 Grove St, Paxton, MA 01612 and is currently estimated at $518,060, approximately $266 per square foot. 207 Grove St is a home located in Worcester County with nearby schools including Wachusett Regional High School and Holden Christian Academy.
Ownership History
Date
Name
Owned For
Owner Type
Purchase Details
Closed on
Jul 14, 2011
Sold by
Roberts Paul A and Roberts Bethea A
Bought by
Roberts Paul A and Roberts Bethea A
Current Estimated Value
Purchase Details
Closed on
Dec 14, 1993
Sold by
Smith Thomas S and Smith Jean A
Bought by
Roberts Paul A and Roberts Bethea A
Home Financials for this Owner
Home Financials are based on the most recent Mortgage that was taken out on this home.
Original Mortgage
$68,000
Interest Rate
6.72%
Create a Home Valuation Report for This Property
The Home Valuation Report is an in-depth analysis detailing your home's value as well as a comparison with similar homes in the area
Home Values in the Area
Average Home Value in this Area
Purchase History
| Date | Buyer | Sale Price | Title Company |
|---|---|---|---|
| Roberts Paul A | -- | -- | |
| Roberts Paul A | $7,500 | -- |
Source: Public Records
Mortgage History
| Date | Status | Borrower | Loan Amount |
|---|---|---|---|
| Previous Owner | Roberts Paul A | $25,000 | |
| Previous Owner | Roberts Paul A | $68,000 |
Source: Public Records
Tax History
| Year | Tax Paid | Tax Assessment Tax Assessment Total Assessment is a certain percentage of the fair market value that is determined by local assessors to be the total taxable value of land and additions on the property. | Land | Improvement |
|---|---|---|---|---|
| 2025 | $6,689 | $453,800 | $113,000 | $340,800 |
| 2024 | $6,193 | $385,400 | $113,000 | $272,400 |
| 2023 | $6,251 | $355,600 | $102,600 | $253,000 |
| 2022 | $5,908 | $311,300 | $102,600 | $208,700 |
| 2021 | $5,874 | $297,700 | $93,100 | $204,600 |
| 2020 | $5,882 | $298,100 | $84,600 | $213,500 |
| 2019 | $5,729 | $290,200 | $76,700 | $213,500 |
| 2018 | $3,993 | $253,800 | $73,200 | $180,600 |
| 2017 | $5,142 | $252,200 | $69,700 | $182,500 |
| 2016 | $4,975 | $241,600 | $69,700 | $171,900 |
| 2015 | $4,896 | $235,500 | $69,700 | $165,800 |
| 2014 | $4,746 | $231,400 | $69,700 | $161,700 |
Source: Public Records
Map
Nearby Homes
- 620 Pleasant St
- 9 Forestdale Rd
- 551 Pleasant St
- 106 Paxton Rd
- 78 Asnebumskit Rd
- 4 Crestwood Rd
- 11 Brigham Rd
- LOT 8 Pierre Cir
- 2 Kosta Ave
- 4 Black Hill Rd
- 165 South Rd
- 8 Hemlock St
- 6 Cutler Rd
- 680 Reservoir St
- 17 Walbridge Rd
- 99 Lakeshore Dr
- O0 Mixter Rd
- 105 Mixter Rd
- 236 Turkey Hill Rd
- 189 Maple Ave
Your Personal Tour Guide
Ask me questions while you tour the home.