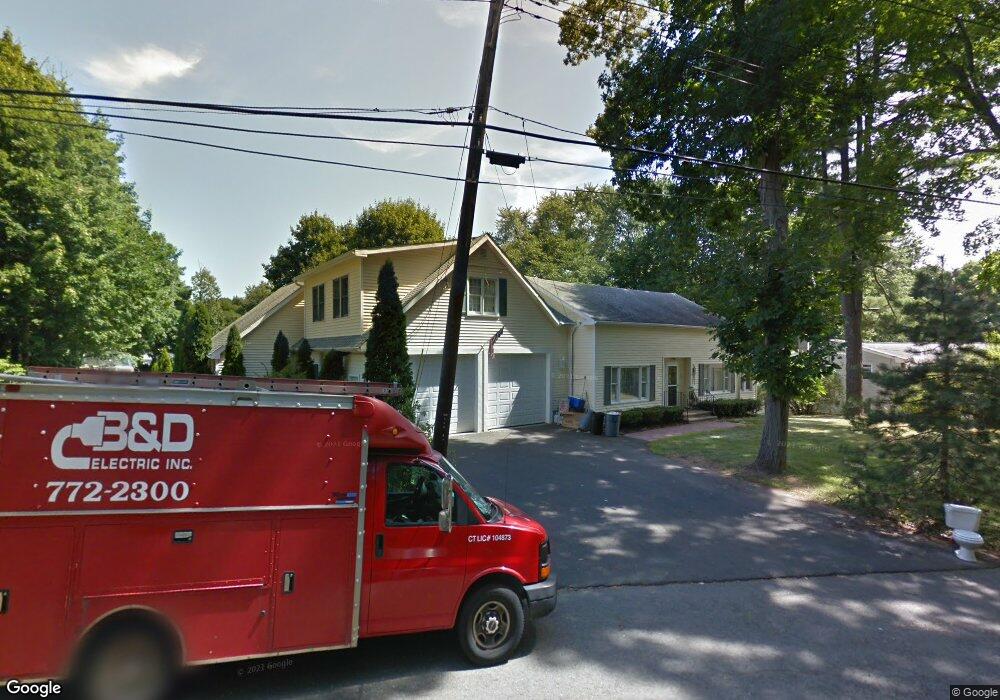
207 Maple St East Haven, CT 06512
Estimated Value: $320,000 - $589,000
3
Beds
3
Baths
2,627
Sq Ft
$190/Sq Ft
Est. Value
About This Home
This home is located at 207 Maple St, East Haven, CT 06512 and is currently estimated at $498,559, approximately $189 per square foot. 207 Maple St is a home located in New Haven County with nearby schools including Deer Run School and East Haven High School.
Ownership History
Date
Name
Owned For
Owner Type
Purchase Details
Closed on
May 11, 1995
Sold by
Eagle Fed Sb
Bought by
Houston Jr Robert
Current Estimated Value
Home Financials for this Owner
Home Financials are based on the most recent Mortgage that was taken out on this home.
Original Mortgage
$71,900
Interest Rate
8.31%
Mortgage Type
Unknown
Purchase Details
Closed on
Mar 29, 1988
Sold by
Mullings Sidney S
Bought by
Thibodeau Susan D
Purchase Details
Closed on
Apr 20, 1987
Sold by
Paul Edna K
Bought by
Gambardella Anette M
Create a Home Valuation Report for This Property
The Home Valuation Report is an in-depth analysis detailing your home's value as well as a comparison with similar homes in the area
Home Values in the Area
Average Home Value in this Area
Purchase History
| Date | Buyer | Sale Price | Title Company |
|---|---|---|---|
| Houston Jr Robert | $79,900 | -- | |
| Thibodeau Susan D | $123,000 | -- | |
| Gambardella Anette M | $105,000 | -- |
Source: Public Records
Mortgage History
| Date | Status | Borrower | Loan Amount |
|---|---|---|---|
| Open | Gambardella Anette M | $100,000 | |
| Closed | Gambardella Anette M | $50,000 | |
| Closed | Gambardella Anette M | $71,900 |
Source: Public Records
Tax History
| Year | Tax Paid | Tax Assessment Tax Assessment Total Assessment is a certain percentage of the fair market value that is determined by local assessors to be the total taxable value of land and additions on the property. | Land | Improvement |
|---|---|---|---|---|
| 2025 | $9,672 | $289,240 | $49,420 | $239,820 |
| 2024 | $9,672 | $289,240 | $49,420 | $239,820 |
| 2023 | $9,024 | $289,240 | $49,420 | $239,820 |
| 2022 | $9,024 | $289,240 | $49,420 | $239,820 |
| 2021 | $8,252 | $240,920 | $47,970 | $192,950 |
| 2020 | $8,252 | $240,920 | $47,970 | $192,950 |
| 2019 | $7,811 | $240,920 | $47,970 | $192,950 |
| 2018 | $7,818 | $240,920 | $47,970 | $192,950 |
| 2017 | $7,601 | $240,920 | $47,970 | $192,950 |
| 2016 | $7,468 | $236,710 | $52,920 | $183,790 |
| 2015 | $7,468 | $236,710 | $52,920 | $183,790 |
| 2014 | $7,587 | $236,710 | $52,920 | $183,790 |
Source: Public Records
Map
Nearby Homes
- 55 Thompson St Unit 11G
- 75 Redwood Dr Unit 103
- 75 Redwood Dr Unit 907
- 123 Pleasant Ave
- 1 Birch Ln Unit A
- 12 Glenmoor Dr
- 57 Glenmoor Dr
- 203 Thompson St Unit E
- 337 Thompson St
- 8 River Rd
- 25 River Rd
- 421 Strong St
- 445 Strong St
- 427 Strong St
- 406 Strong St
- 187 Eddon Dr
- 65 Russo Ave Unit I4
- 173 Russo Ave Unit 304
- 59 Wood Terrace
- 104 Gene St
Your Personal Tour Guide
Ask me questions while you tour the home.