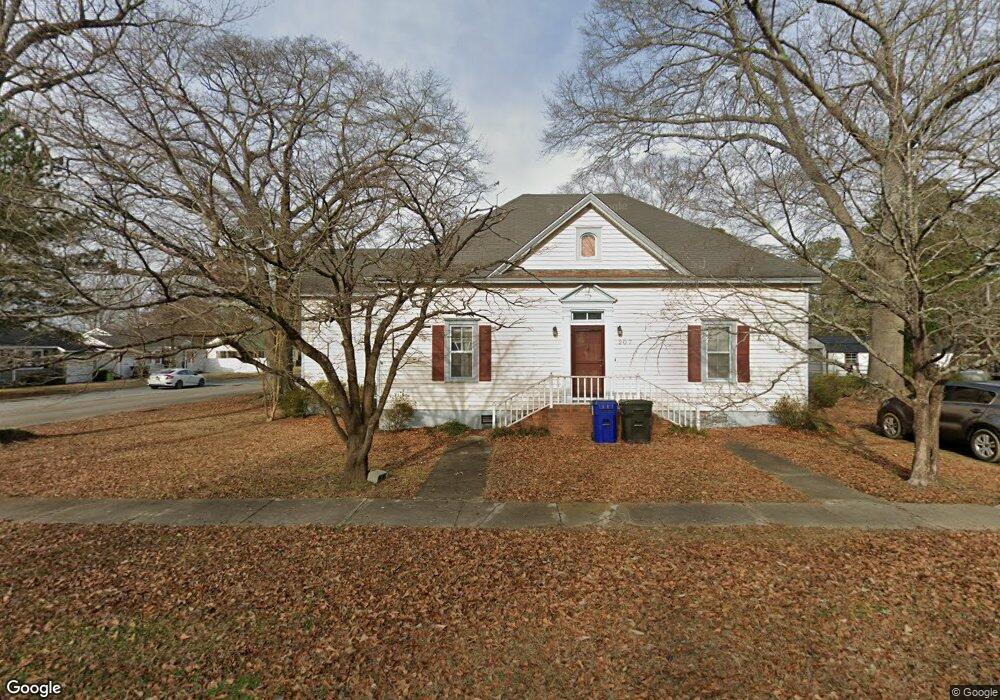
207 Pine St Fremont, NC 27830
Estimated Value: $155,000 - $222,000
3
Beds
2
Baths
1,426
Sq Ft
$135/Sq Ft
Est. Value
About This Home
This home is located at 207 Pine St, Fremont, NC 27830 and is currently estimated at $192,667, approximately $135 per square foot. 207 Pine St is a home with nearby schools including Fremont Stars Elementary School, Norwayne Middle School, and Charles B. Aycock High School.
Ownership History
Date
Name
Owned For
Owner Type
Purchase Details
Closed on
May 31, 2018
Sold by
Hardison Forestree Inc
Bought by
Hardison Acres Llc
Current Estimated Value
Home Financials for this Owner
Home Financials are based on the most recent Mortgage that was taken out on this home.
Original Mortgage
$320,000
Interest Rate
4.8%
Mortgage Type
New Conventional
Purchase Details
Closed on
Dec 14, 2015
Sold by
Cuddington Harold
Bought by
Hardison Forestree Inc
Purchase Details
Closed on
Jan 1, 1982
Create a Home Valuation Report for This Property
The Home Valuation Report is an in-depth analysis detailing your home's value as well as a comparison with similar homes in the area
Purchase History
| Date | Buyer | Sale Price | Title Company |
|---|---|---|---|
| Hardison Acres Llc | -- | None Available | |
| Hardison Forestree Inc | -- | None Available | |
| -- | $43,000 | -- |
Source: Public Records
Mortgage History
| Date | Status | Borrower | Loan Amount |
|---|---|---|---|
| Previous Owner | Hardison Acres Llc | $320,000 |
Source: Public Records
Tax History
| Year | Tax Paid | Tax Assessment Tax Assessment Total Assessment is a certain percentage of the fair market value that is determined by local assessors to be the total taxable value of land and additions on the property. | Land | Improvement |
|---|---|---|---|---|
| 2025 | $1,385 | $113,910 | $12,730 | $101,180 |
| 2024 | $924 | $62,970 | $7,280 | $55,690 |
| 2023 | $896 | $62,970 | $7,280 | $55,690 |
| 2022 | $896 | $62,970 | $7,280 | $55,690 |
| 2021 | $874 | $62,970 | $7,280 | $55,690 |
| 2020 | $840 | $62,970 | $7,280 | $55,690 |
| 2018 | $824 | $62,740 | $7,280 | $55,460 |
| 2017 | $416 | $62,740 | $7,280 | $55,460 |
| 2016 | $416 | $62,740 | $7,280 | $55,460 |
| 2015 | $417 | $62,740 | $7,280 | $55,460 |
| 2014 | $418 | $62,740 | $7,280 | $55,460 |
Source: Public Records
Map
Nearby Homes
- 203 S Pender St
- 103 S Pender St
- 305 S Sycamore St
- 105 W Wayne St
- 302 N Sycamore St
- 408 Carolina St
- 608 S Goldsboro St
- 202 E North St
- 600 S Vance St
- 604 S Vance St
- 606 S Vance St
- 608 S Vance St
- 200 Barnes St
- 103 Fynloch Chase Dr
- 107 Waterstone Ct
- 679 N Carolina 222
- 679 Nc Highway 222 E
- 719 New Daniels Chapel Rd
- 108 Slew Ct
- 107 Slew Ct
Your Personal Tour Guide
Ask me questions while you tour the home.