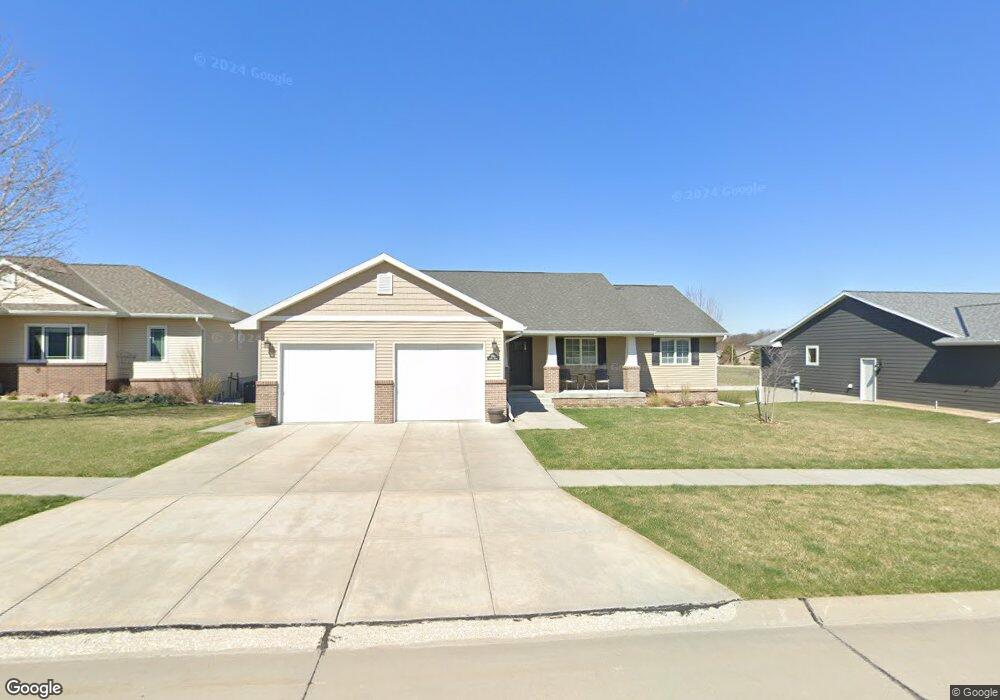
2070 Lewis St Aurora, NE 68818
Estimated Value: $302,000 - $394,000
3
Beds
3
Baths
1,651
Sq Ft
$220/Sq Ft
Est. Value
About This Home
This home is located at 2070 Lewis St, Aurora, NE 68818 and is currently estimated at $363,020, approximately $219 per square foot. 2070 Lewis St is a home with nearby schools including Aurora Elementary School, Aurora Middle School, and Aurora High School.
Ownership History
Date
Name
Owned For
Owner Type
Purchase Details
Closed on
May 17, 2012
Sold by
Dana Point Development Corp
Bought by
Wilsson Gordon J and Wilsson Amy L
Current Estimated Value
Home Financials for this Owner
Home Financials are based on the most recent Mortgage that was taken out on this home.
Original Mortgage
$209,721
Outstanding Balance
$143,474
Interest Rate
3.86%
Mortgage Type
New Conventional
Estimated Equity
$219,546
Purchase Details
Closed on
Jun 23, 2005
Sold by
Aurora Development Corp
Bought by
Brechbill Cristopher J and Brechbill Lori M
Create a Home Valuation Report for This Property
The Home Valuation Report is an in-depth analysis detailing your home's value as well as a comparison with similar homes in the area
Home Values in the Area
Average Home Value in this Area
Purchase History
We collect this data history from publicly available records. To have your information removed, we recommend requesting removal directly through your county’s website.
| Date | Buyer | Sale Price | Title Company |
|---|---|---|---|
| Wilsson Gordon J | -- | None Available | |
| Brechbill Cristopher J | $7,000 | -- |
Source: Public Records
Mortgage History
We collect this data history from publicly available records. To have your information removed, we recommend requesting removal directly through your county’s website.
| Date | Status | Borrower | Loan Amount |
|---|---|---|---|
| Open | Wilsson Gordon J | $209,721 |
Source: Public Records
Tax History
| Year | Tax Paid | Tax Assessment Tax Assessment Total Assessment is a certain percentage of the fair market value that is determined by local assessors to be the total taxable value of land and additions on the property. | Land | Improvement |
|---|---|---|---|---|
| 2025 | $3,775 | $355,515 | $55,000 | $300,515 |
| 2024 | $3,336 | $308,320 | $55,000 | $253,320 |
| 2023 | $4,055 | $287,405 | $55,000 | $232,405 |
| 2022 | $4,300 | $287,405 | $55,000 | $232,405 |
| 2021 | $3,851 | $253,275 | $55,000 | $198,275 |
| 2020 | $3,753 | $253,275 | $55,000 | $198,275 |
| 2019 | $3,513 | $238,590 | $55,000 | $183,590 |
| 2018 | $3,359 | $238,590 | $55,000 | $183,590 |
| 2017 | $2,915 | $206,880 | $23,290 | $183,590 |
| 2016 | $2,830 | $206,880 | $23,290 | $183,590 |
| 2010 | $193 | $10,200 | $0 | $0 |
Source: Public Records
Map
Nearby Homes
Your Personal Tour Guide
Ask me questions while you tour the home.