208 1/2 E Pine Ave Findlay, OH 45840
Estimated Value: $142,388 - $205,000
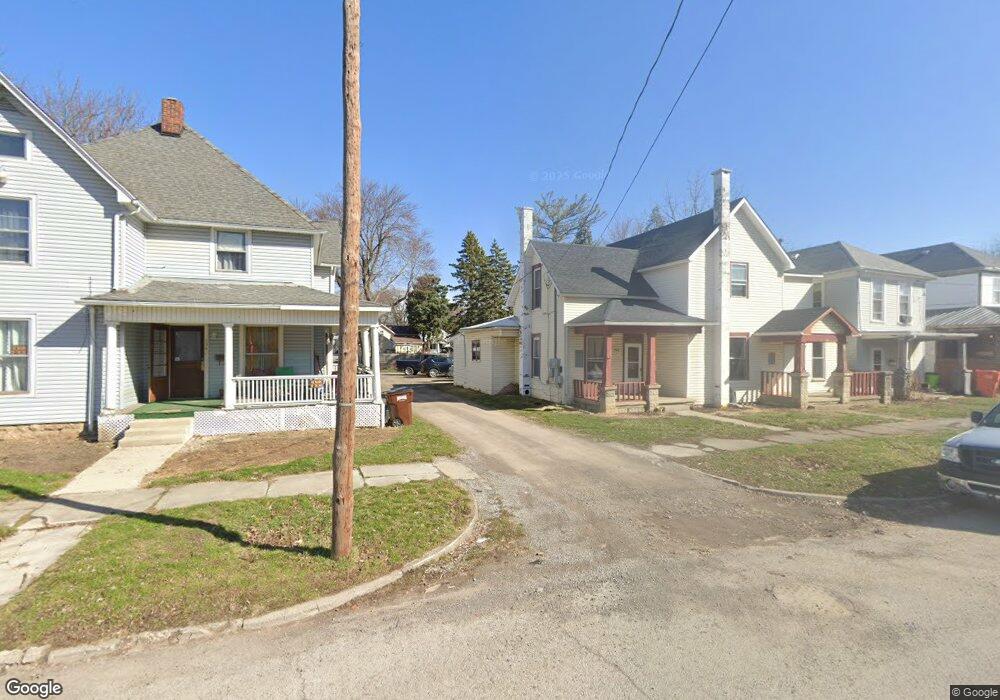
About This Home
This home is located at 208 1/2 E Pine Ave, Findlay, OH 45840 and is currently estimated at $164,597, approximately $73 per square foot. 208 1/2 E Pine Ave is a home located in Hancock County with nearby schools including Whittier Primary School, Bigelow Hill Elementary School, and Glenwood Middle School.
Ownership History
We collect this data history from publicly available records. To have your information removed, we recommend requesting removal directly through your county’s website.
Purchase Details
Home Financials for this Owner
Home Financials are based on the most recent Mortgage that was taken out on this home.Purchase Details
Purchase Details
Home Values in the Area
Average Home Value in this Area
Purchase History
We collect this data history from publicly available records. To have your information removed, we recommend requesting removal directly through your county’s website.
| Date | Buyer | Sale Price | Title Company |
|---|---|---|---|
| $98,000 | Abstract Title Agency | ||
| $17,900 | -- | ||
| -- | -- |
Mortgage History
We collect this data history from publicly available records. To have your information removed, we recommend requesting removal directly through your county’s website.
| Date | Status | Borrower | Loan Amount |
|---|---|---|---|
| Closed | $68,600 | ||
| Closed | $118,800 |
Tax History
We collect this data history from publicly available records. To have your information removed, we recommend requesting removal directly through your county’s website.
| Year | Tax Paid | Tax Assessment Tax Assessment Total Assessment is a certain percentage of the fair market value that is determined by local assessors to be the total taxable value of land and additions on the property. | Land | Improvement |
|---|---|---|---|---|
| 2025 | $1,296 | $41,190 | $6,180 | $35,010 |
| 2024 | $1,174 | $32,220 | $4,830 | $27,390 |
| 2023 | $1,177 | $32,220 | $4,830 | $27,390 |
| 2022 | $1,172 | $32,220 | $4,830 | $27,390 |
| 2021 | $1,005 | $24,060 | $4,830 | $19,230 |
| 2020 | $1,005 | $24,060 | $4,830 | $19,230 |
| 2019 | $985 | $24,060 | $4,830 | $19,230 |
| 2018 | $944 | $21,150 | $4,200 | $16,950 |
| 2017 | $472 | $21,150 | $4,200 | $16,950 |
| 2016 | $942 | $21,150 | $4,200 | $16,950 |
| 2015 | $997 | $22,170 | $4,200 | $17,970 |
| 2014 | $997 | $22,170 | $4,200 | $17,970 |
| 2012 | $1,291 | $28,480 | $4,200 | $24,280 |
Map
- 723 N Main St
- 317 Garfield Ave
- 617 Lynn St
- 308 Garfield Ave
- 206 Midland Ave
- 322 Midland Ave
- 517 Center St
- 755 Dayton Ave
- 144 E Foulke Ave
- 640 Center St
- 643 Center St
- 434 Davis St
- 602 Washington St
- 439 Carnahan Ave
- 608 W Front St
- 627 W Foulke Ave
- 118 Clifton Ave
- 810 Broad Ave
- 146 Clifton Ave
- 225 19th St
Ask me questions while you tour the home.