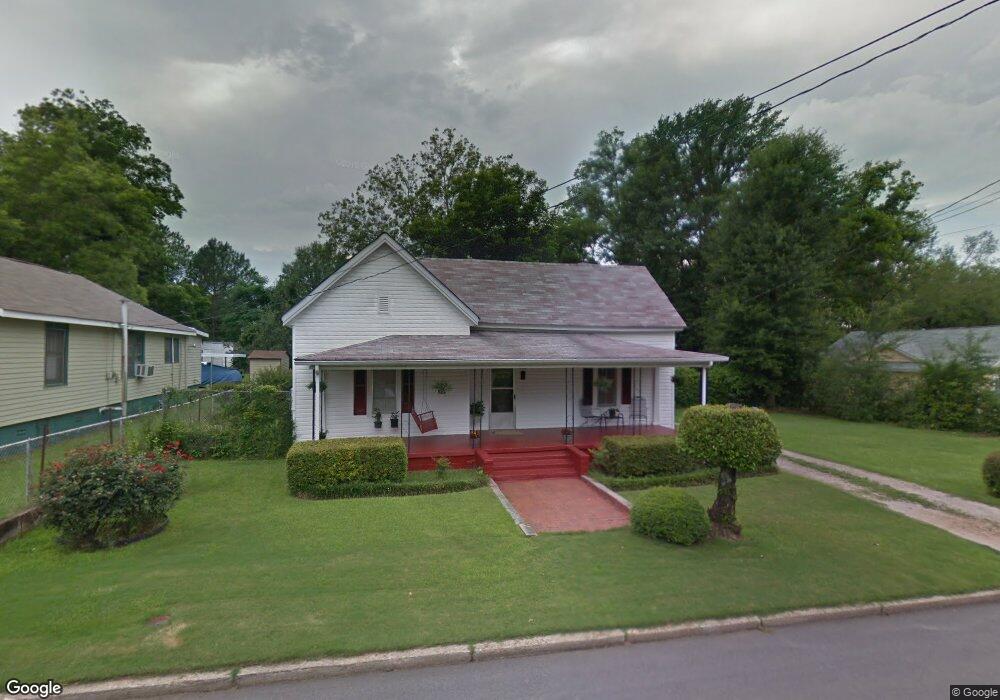
208 Johnson St Lagrange, GA 30241
Estimated Value: $55,000 - $109,000
3
Beds
1
Bath
1,562
Sq Ft
$59/Sq Ft
Est. Value
About This Home
This home is located at 208 Johnson St, Lagrange, GA 30241 and is currently estimated at $91,513, approximately $58 per square foot. 208 Johnson St is a home located in Troup County with nearby schools including Hollis Hand Elementary School, Franklin Forest Elementary School, and Ethel W. Kight Elementary School.
Ownership History
Date
Name
Owned For
Owner Type
Purchase Details
Closed on
Jul 31, 2025
Sold by
Ransom Alonza R
Bought by
Ransom Doris B
Current Estimated Value
Purchase Details
Closed on
Dec 15, 2023
Sold by
Ransom Cynthia H
Bought by
Patton Demarco
Purchase Details
Closed on
Jun 27, 1994
Sold by
Wood Christine
Bought by
Ransom Alonza R and Ransom Doris B
Purchase Details
Closed on
Jun 20, 1994
Sold by
Ransom Alonza
Bought by
Wood Christine
Purchase Details
Closed on
Mar 24, 1992
Sold by
Wood Raymond M
Bought by
Ransom Alonza
Purchase Details
Closed on
Dec 8, 1966
Sold by
Head G H
Bought by
Wood Raymond M
Create a Home Valuation Report for This Property
The Home Valuation Report is an in-depth analysis detailing your home's value as well as a comparison with similar homes in the area
Purchase History
We collect this data history from publicly available records. To have your information removed, we recommend requesting removal directly through your county’s website.
| Date | Buyer | Sale Price | Title Company |
|---|---|---|---|
| Ransom Doris B | -- | -- | |
| Patton Demarco | $15,000 | -- | |
| Ransom Alonza R | $23,000 | -- | |
| Wood Christine | -- | -- | |
| Ransom Alonza | -- | -- | |
| Wood Raymond M | -- | -- |
Source: Public Records
Tax History
| Year | Tax Paid | Tax Assessment Tax Assessment Total Assessment is a certain percentage of the fair market value that is determined by local assessors to be the total taxable value of land and additions on the property. | Land | Improvement |
|---|---|---|---|---|
| 2025 | $838 | $33,800 | $4,040 | $29,760 |
| 2024 | $784 | $30,720 | $4,040 | $26,680 |
| 2023 | $280 | $30,160 | $4,040 | $26,120 |
| 2022 | $740 | $28,520 | $4,040 | $24,480 |
| 2021 | $763 | $27,284 | $3,640 | $23,644 |
| 2020 | $763 | $27,284 | $3,640 | $23,644 |
| 2019 | $696 | $25,076 | $3,636 | $21,440 |
| 2018 | $696 | $25,076 | $3,636 | $21,440 |
| 2017 | $696 | $25,076 | $3,636 | $21,440 |
| 2016 | $679 | $24,505 | $3,636 | $20,869 |
| 2015 | $681 | $24,505 | $3,636 | $20,869 |
| 2014 | $703 | $25,200 | $3,636 | $21,564 |
| 2013 | -- | $26,722 | $3,636 | $23,086 |
Source: Public Records
Map
Nearby Homes
Your Personal Tour Guide
Ask me questions while you tour the home.