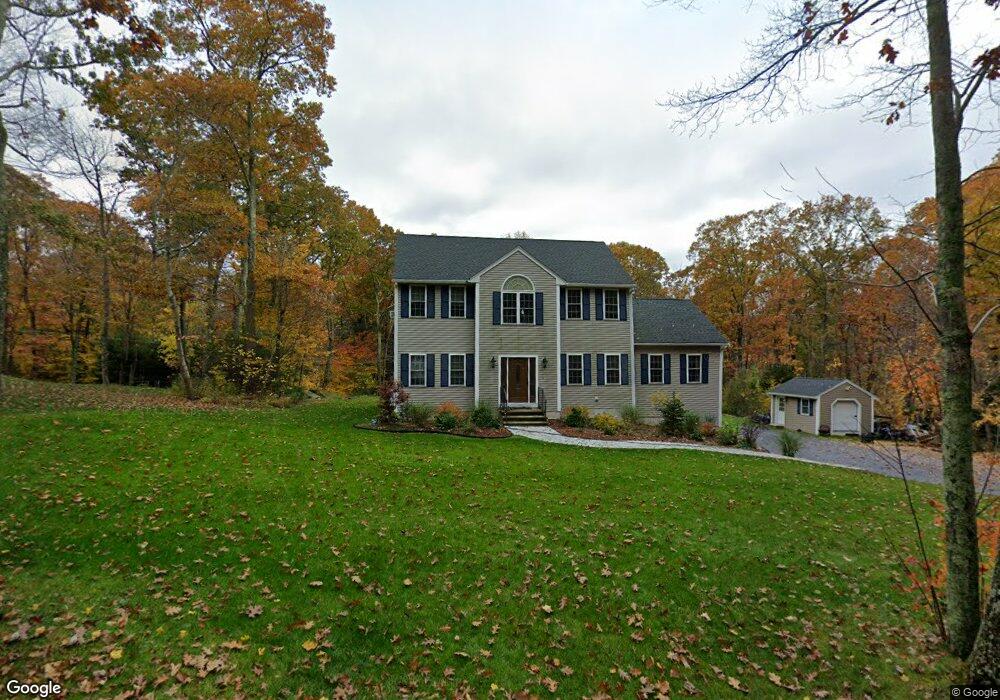
209 SE Main St Douglas, MA 01516
Douglas AreaEstimated Value: $643,189 - $693,000
About This Home
This home is located at 209 SE Main St, Douglas, MA 01516 and is currently estimated at $668,047, approximately $294 per square foot. 209 SE Main St is a home located in Worcester County with nearby schools including Douglas Primary School, Douglas Middle School, and Douglas High School.
Ownership History
We collect this data history from publicly available records. To have your information removed, we recommend requesting removal directly through your county’s website.
Purchase Details
Home Financials for this Owner
Home Financials are based on the most recent Mortgage that was taken out on this home.Home Values in the Area
Average Home Value in this Area
Purchase History
We collect this data history from publicly available records. To have your information removed, we recommend requesting removal directly through your county’s website.
| Date | Buyer | Sale Price | Title Company |
|---|---|---|---|
| $382,000 | -- |
Mortgage History
We collect this data history from publicly available records. To have your information removed, we recommend requesting removal directly through your county’s website.
| Date | Status | Borrower | Loan Amount |
|---|---|---|---|
| Open | $100,000 | ||
| Open | $280,000 | ||
| Closed | $285,000 | ||
| Closed | $291,625 | ||
| Closed | $268,000 | ||
| Closed | $57,300 |
Tax History
We collect this data history from publicly available records. To have your information removed, we recommend requesting removal directly through your county’s website.
| Year | Tax Paid | Tax Assessment Tax Assessment Total Assessment is a certain percentage of the fair market value that is determined by local assessors to be the total taxable value of land and additions on the property. | Land | Improvement |
|---|---|---|---|---|
| 2025 | $69 | $520,300 | $99,100 | $421,200 |
| 2024 | $6,748 | $499,100 | $90,100 | $409,000 |
| 2023 | $6,573 | $457,700 | $90,100 | $367,600 |
| 2022 | $6,699 | $410,000 | $83,300 | $326,700 |
| 2021 | $6,569 | $392,900 | $79,300 | $313,600 |
| 2020 | $6,403 | $377,100 | $79,300 | $297,800 |
| 2019 | $6,230 | $356,000 | $79,300 | $276,700 |
| 2018 | $5,559 | $345,900 | $79,300 | $266,600 |
| 2017 | $5,350 | $320,000 | $82,500 | $237,500 |
| 2016 | $5,192 | $308,700 | $82,500 | $226,200 |
| 2015 | $5,081 | $308,700 | $82,500 | $226,200 |
Map
- 211 SE Main St
- 197 SE Main St
- 200 SE Main St
- 0 S East Main St
- 269 S East Main St
- 196 SE Main St
- 213 SE Main St
- 204 SE Main St
- 54 S East Main St
- 183 S East Main St
- 215 SE Main St
- 210 SE Main St
- 217 SE Main St
- 218 SE Main St
- 218 SE Main St
- 218 S East Main St
- 221 S East Main St
- 176 SE Main St
- 229 SE Main St
- 65 Locust St
Ask me questions while you tour the home.