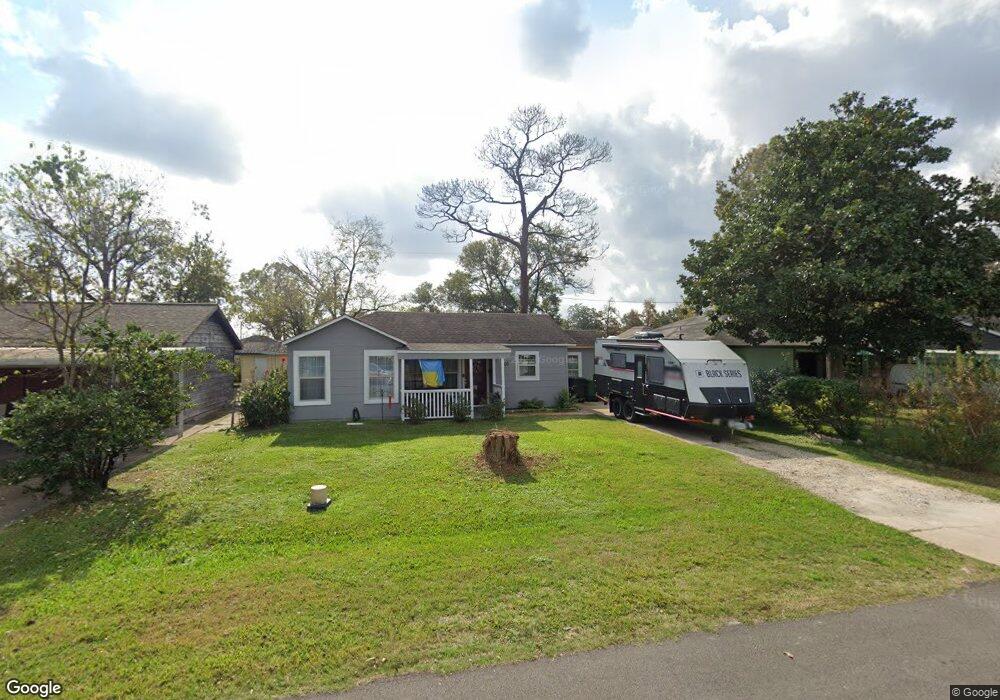
209 W 44th St Houston, TX 77018
Independence Heights NeighborhoodEstimated Value: $178,721 - $299,000
2
Beds
1
Bath
1,117
Sq Ft
$206/Sq Ft
Est. Value
About This Home
This home is located at 209 W 44th St, Houston, TX 77018 and is currently estimated at $230,430, approximately $206 per square foot. 209 W 44th St is a home located in Harris County with nearby schools including Kennedy Elementary School, Williams Middle, and Booker T Washington Sr High.
Ownership History
Date
Name
Owned For
Owner Type
Purchase Details
Closed on
Feb 27, 2020
Sold by
Matta Revocable Trust
Bought by
Furgason Phillip
Current Estimated Value
Purchase Details
Closed on
May 8, 2019
Sold by
Matta Maria Theresa and Matta Theresa M
Bought by
Matta Revocable Trust
Purchase Details
Closed on
Sep 2, 2016
Sold by
Smith William Gerard and Smith Angelia
Bought by
Matta M Theresa
Purchase Details
Closed on
May 22, 2010
Sold by
Boone Christene E
Bought by
Smith William Gerard
Create a Home Valuation Report for This Property
The Home Valuation Report is an in-depth analysis detailing your home's value as well as a comparison with similar homes in the area
Home Values in the Area
Average Home Value in this Area
Purchase History
| Date | Buyer | Sale Price | Title Company |
|---|---|---|---|
| Furgason Phillip | -- | None Available | |
| Matta Revocable Trust | -- | None Available | |
| Matta M Theresa | -- | None Available | |
| Smith William Gerard | -- | None Available |
Source: Public Records
Tax History
| Year | Tax Paid | Tax Assessment Tax Assessment Total Assessment is a certain percentage of the fair market value that is determined by local assessors to be the total taxable value of land and additions on the property. | Land | Improvement |
|---|---|---|---|---|
| 2025 | $14 | $192,150 | $156,600 | $35,550 |
| 2024 | $14 | $189,250 | $156,600 | $32,650 |
| 2023 | $1 | $166,005 | $139,200 | $26,805 |
| 2022 | $3,278 | $166,005 | $139,200 | $26,805 |
| 2021 | $3,155 | $135,357 | $110,200 | $25,157 |
| 2020 | $3,078 | $127,111 | $104,400 | $22,711 |
| 2019 | $2,125 | $83,990 | $52,200 | $31,790 |
| 2018 | $1,888 | $74,724 | $52,200 | $22,524 |
| 2017 | $1,596 | $63,124 | $40,600 | $22,524 |
| 2016 | $1,341 | $53,026 | $40,600 | $12,426 |
| 2015 | $991 | $47,090 | $29,000 | $18,090 |
| 2014 | $991 | $38,543 | $20,300 | $18,243 |
Source: Public Records
Map
Nearby Homes
Your Personal Tour Guide
Ask me questions while you tour the home.