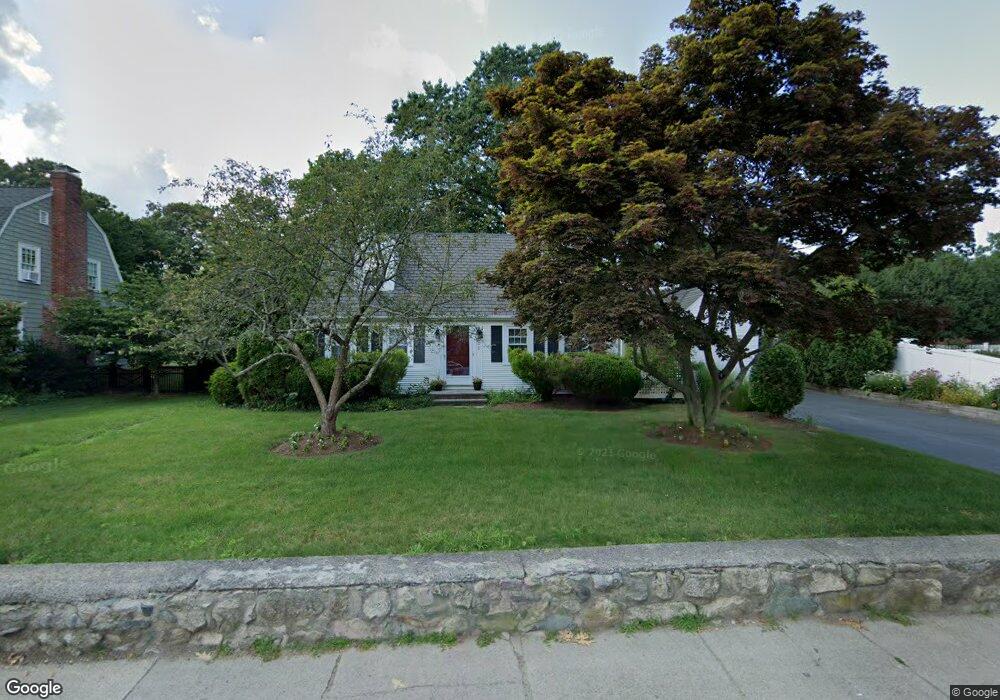
209 Walnut St Dedham, MA 02026
Oakdale NeighborhoodEstimated Value: $931,000 - $1,178,000
3
Beds
2
Baths
2,556
Sq Ft
$423/Sq Ft
Est. Value
About This Home
This home is located at 209 Walnut St, Dedham, MA 02026 and is currently estimated at $1,081,896, approximately $423 per square foot. 209 Walnut St is a home located in Norfolk County with nearby schools including Avery, Dedham Middle School, and Dedham High School.
Ownership History
Date
Name
Owned For
Owner Type
Purchase Details
Closed on
Mar 17, 2020
Sold by
Michael J Ambrose Nt
Bought by
Dimarzio Katherine F
Current Estimated Value
Purchase Details
Closed on
Feb 23, 1987
Sold by
Johnson Andrew M
Bought by
Ambrose Michael
Home Financials for this Owner
Home Financials are based on the most recent Mortgage that was taken out on this home.
Original Mortgage
$100,000
Interest Rate
9.24%
Mortgage Type
Purchase Money Mortgage
Create a Home Valuation Report for This Property
The Home Valuation Report is an in-depth analysis detailing your home's value as well as a comparison with similar homes in the area
Home Values in the Area
Average Home Value in this Area
Purchase History
We collect this data history from publicly available records. To have your information removed, we recommend requesting removal directly through your county’s website.
| Date | Buyer | Sale Price | Title Company |
|---|---|---|---|
| Dimarzio Katherine F | -- | None Available | |
| Ambrose Michael | $200,000 | -- |
Source: Public Records
Mortgage History
We collect this data history from publicly available records. To have your information removed, we recommend requesting removal directly through your county’s website.
| Date | Status | Borrower | Loan Amount |
|---|---|---|---|
| Previous Owner | Ambrose Michael | $55,000 | |
| Previous Owner | Ambrose Michael | $100,000 |
Source: Public Records
Tax History
| Year | Tax Paid | Tax Assessment Tax Assessment Total Assessment is a certain percentage of the fair market value that is determined by local assessors to be the total taxable value of land and additions on the property. | Land | Improvement |
|---|---|---|---|---|
| 2025 | $12,385 | $981,400 | $388,300 | $593,100 |
| 2024 | $12,630 | $1,010,400 | $373,200 | $637,200 |
| 2023 | $11,235 | $875,000 | $327,500 | $547,500 |
| 2022 | $10,468 | $784,100 | $299,600 | $484,500 |
| 2021 | $9,944 | $727,400 | $304,600 | $422,800 |
| 2020 | $9,675 | $705,200 | $291,200 | $414,000 |
| 2019 | $9,500 | $671,400 | $282,500 | $388,900 |
| 2018 | $9,222 | $633,800 | $254,700 | $379,100 |
| 2017 | $8,933 | $605,200 | $226,100 | $379,100 |
| 2016 | $8,774 | $566,400 | $204,200 | $362,200 |
| 2015 | $9,098 | $573,300 | $233,400 | $339,900 |
| 2014 | $9,322 | $579,700 | $233,400 | $346,300 |
Source: Public Records
Map
Nearby Homes
- 180 Walnut St
- 105 Oakdale Ave
- 73 Walnut St
- 103 Madison St
- 8 Contentment Place
- 374 Whiting Ave
- 173 Jefferson St
- 40 High St Unit 308
- 40 High St Unit 205
- 30 High St ( Cass St Entrance) Unit 209
- 76 Maverick St
- 3 S Stone Mill Dr Unit 225
- 21 Chauncey St
- 122 Milton St Unit 122
- 18 Fales Rd
- 7 S Stone Mill Dr Unit 403
- 36 N Stone Mill Dr Unit 1224
- 427 High St
- 437 High St
- 20 N Stone Mill Dr Unit 1026
Your Personal Tour Guide
Ask me questions while you tour the home.