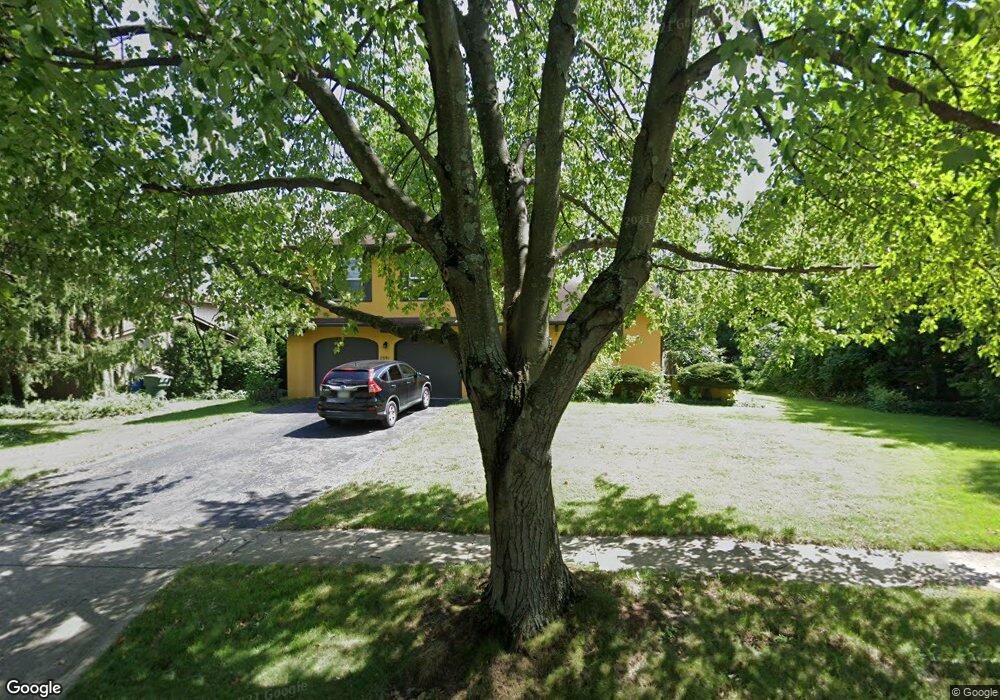
2091 E Maplewood Columbus, OH 43229
Forest Park East NeighborhoodEstimated Value: $262,941 - $330,000
3
Beds
2
Baths
1,524
Sq Ft
$189/Sq Ft
Est. Value
About This Home
This home is located at 2091 E Maplewood, Columbus, OH 43229 and is currently estimated at $287,985, approximately $188 per square foot. 2091 E Maplewood is a home located in Franklin County with nearby schools including Parkmoor Elementary School, Woodward Park Middle School, and Northland High School.
Ownership History
Date
Name
Owned For
Owner Type
Purchase Details
Closed on
Aug 16, 2017
Sold by
Morin Matthew R and Morin Anne E
Bought by
Ahmedin Omer Khelifa
Current Estimated Value
Home Financials for this Owner
Home Financials are based on the most recent Mortgage that was taken out on this home.
Original Mortgage
$111,920
Interest Rate
4.04%
Mortgage Type
New Conventional
Purchase Details
Closed on
Feb 1, 2013
Sold by
Morin Matthew R and Morin Anne E
Bought by
Morin Matthew R and Morin Anne E
Home Financials for this Owner
Home Financials are based on the most recent Mortgage that was taken out on this home.
Original Mortgage
$116,328
Interest Rate
4.56%
Mortgage Type
FHA
Purchase Details
Closed on
Mar 14, 2006
Sold by
Mance Patricia M
Bought by
Morin Matthew R and Stout Anne E
Home Financials for this Owner
Home Financials are based on the most recent Mortgage that was taken out on this home.
Original Mortgage
$130,935
Interest Rate
6.38%
Mortgage Type
FHA
Purchase Details
Closed on
Mar 10, 1989
Bought by
Mance Patricia M
Create a Home Valuation Report for This Property
The Home Valuation Report is an in-depth analysis detailing your home's value as well as a comparison with similar homes in the area
Home Values in the Area
Average Home Value in this Area
Purchase History
| Date | Buyer | Sale Price | Title Company |
|---|---|---|---|
| Ahmedin Omer Khelifa | $136,700 | Land Title Box | |
| Morin Matthew R | -- | None Available | |
| Morin Matthew R | $139,000 | Title First | |
| Mance Patricia M | -- | -- |
Source: Public Records
Mortgage History
| Date | Status | Borrower | Loan Amount |
|---|---|---|---|
| Previous Owner | Ahmedin Omer Khelifa | $111,920 | |
| Previous Owner | Morin Matthew R | $116,328 | |
| Previous Owner | Morin Matthew R | $130,935 |
Source: Public Records
Tax History
| Year | Tax Paid | Tax Assessment Tax Assessment Total Assessment is a certain percentage of the fair market value that is determined by local assessors to be the total taxable value of land and additions on the property. | Land | Improvement |
|---|---|---|---|---|
| 2025 | $3,214 | $71,620 | $21,390 | $50,230 |
| 2024 | $3,214 | $71,620 | $21,390 | $50,230 |
| 2023 | $3,173 | $71,610 | $21,385 | $50,225 |
| 2022 | $2,943 | $56,740 | $15,160 | $41,580 |
| 2021 | $2,948 | $56,740 | $15,160 | $41,580 |
| 2020 | $2,952 | $56,740 | $15,160 | $41,580 |
| 2019 | $2,591 | $42,710 | $11,240 | $31,470 |
| 2018 | $2,559 | $42,710 | $11,240 | $31,470 |
| 2017 | $2,589 | $42,710 | $11,240 | $31,470 |
| 2016 | $2,523 | $36,400 | $9,520 | $26,880 |
| 2015 | $2,301 | $36,400 | $9,520 | $26,880 |
| 2014 | $2,257 | $36,400 | $9,520 | $26,880 |
| 2013 | $1,138 | $38,290 | $10,010 | $28,280 |
Source: Public Records
Map
Nearby Homes
- 2251 Tuliptree Ave
- 2087 Teakwood Dr
- 1862 Torchwood Dr
- 5092 Riverbirch Dr N
- 4979 Lyle Rd
- 5486 Pine Bluff Rd
- 2414 Taymouth Rd
- 5556 Parkshire Dr Unit 5556
- 1638 Arrowood Loop N
- 2177 Margo Rd
- 5726 Beechcroft Rd Unit J
- 4852 Snowbird Cir Unit 13B
- 1685 Norma Rd
- 5720 Beechcroft Rd Unit B
- 5732 Beechcroft Rd Unit B
- 1687 Brookfield Square S
- 5352 Hazelwood Rd
- 5705 Pine Tree St S Unit F
- 4772 Harr Ct
- 0 Chester Rd
- 2091 Maplewood Dr
- 2101 Maplewood Dr
- 2081 Maplewood Dr
- 5120 Northtowne Blvd
- 5109 Treeridge St
- 2113 Maplewood Dr
- 5110 Northtowne Blvd
- 2124 Blackoak Ave
- 2094 Maplewood Dr
- 5146 Northtowne Blvd
- 2123 Maplewood Dr
- 5101 Treeridge St
- 5168 Honeytree Loop E
- 2131 Maplewood Dr
- 5156 Northtowne Blvd
- 2136 Blackoak Ave
- 5089 Treeridge St
- 5177 Honeytree Loop E
- 2118 Maplewood Dr
- 2064 Northtowne Ct
Your Personal Tour Guide
Ask me questions while you tour the home.