21 Avalon Rd Stoneham, MA 02180
Haywardville NeighborhoodEstimated Value: $841,000 - $928,000
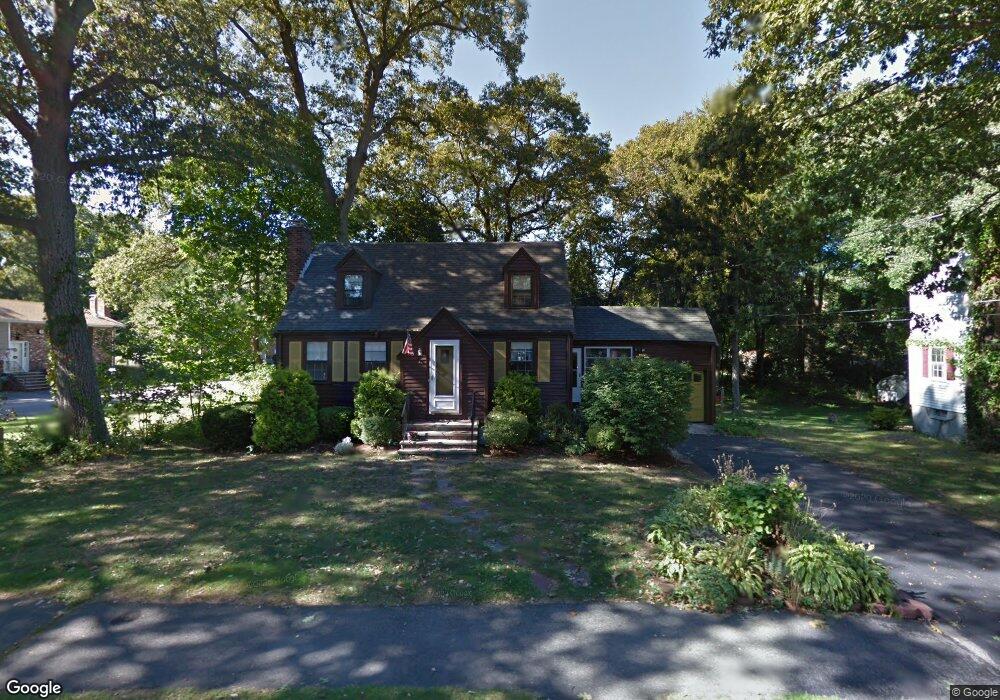
About This Home
This home is located at 21 Avalon Rd, Stoneham, MA 02180 and is currently estimated at $877,844, approximately $428 per square foot. 21 Avalon Rd is a home located in Middlesex County with nearby schools including Stoneham High School, St. Patrick Elementary School, and Melrose Montessori School.
Ownership History
We collect this data history from publicly available records. To have your information removed, we recommend requesting removal directly through your county’s website.
Purchase Details
Home Financials for this Owner
Home Financials are based on the most recent Mortgage that was taken out on this home.Home Values in the Area
Average Home Value in this Area
Purchase History
We collect this data history from publicly available records. To have your information removed, we recommend requesting removal directly through your county’s website.
| Date | Buyer | Sale Price | Title Company |
|---|---|---|---|
| -- | First American Title |
Mortgage History
We collect this data history from publicly available records. To have your information removed, we recommend requesting removal directly through your county’s website.
| Date | Status | Borrower | Loan Amount |
|---|---|---|---|
| Previous Owner | $442,500 |
Tax History
We collect this data history from publicly available records. To have your information removed, we recommend requesting removal directly through your county’s website.
| Year | Tax Paid | Tax Assessment Tax Assessment Total Assessment is a certain percentage of the fair market value that is determined by local assessors to be the total taxable value of land and additions on the property. | Land | Improvement |
|---|---|---|---|---|
| 2025 | $6,514 | $636,800 | $412,000 | $224,800 |
| 2024 | $6,400 | $604,300 | $392,400 | $211,900 |
| 2023 | $6,139 | $553,100 | $353,200 | $199,900 |
| 2022 | $5,437 | $522,300 | $333,500 | $188,800 |
| 2021 | $5,427 | $501,600 | $313,900 | $187,700 |
| 2020 | $5,251 | $486,700 | $302,900 | $183,800 |
| 2019 | $5,340 | $475,900 | $285,600 | $190,300 |
| 2018 | $5,155 | $440,200 | $263,800 | $176,400 |
| 2017 | $5,134 | $414,400 | $252,100 | $162,300 |
| 2016 | $4,869 | $383,400 | $232,700 | $150,700 |
| 2015 | $4,786 | $369,300 | $232,700 | $136,600 |
| 2014 | $4,734 | $350,900 | $213,300 | $137,600 |
Map
- 46 Windsor Rd
- 12 Sunset Rd
- 4 Martin Louis Way
- 177 Franklin St Unit 3
- 2 Orris Place
- 159 Franklin St Unit A2
- 159 Franklin St Unit E6
- 3 Franklin Terrace
- 26 Garden St
- 9 Mendum St
- 1 Confidential Way
- 629 Franklin St
- 33 Brunswick Park Unit 2
- 601 Franklin St Unit 2
- 585 Franklin St Unit 6
- 6 Gavin Cir
- 219 Lynn Fells Pkwy Unit 3
- 3 Fellsmere Ave
- 46 Oakland St
- 17 Tamarock Terrace
Ask me questions while you tour the home.