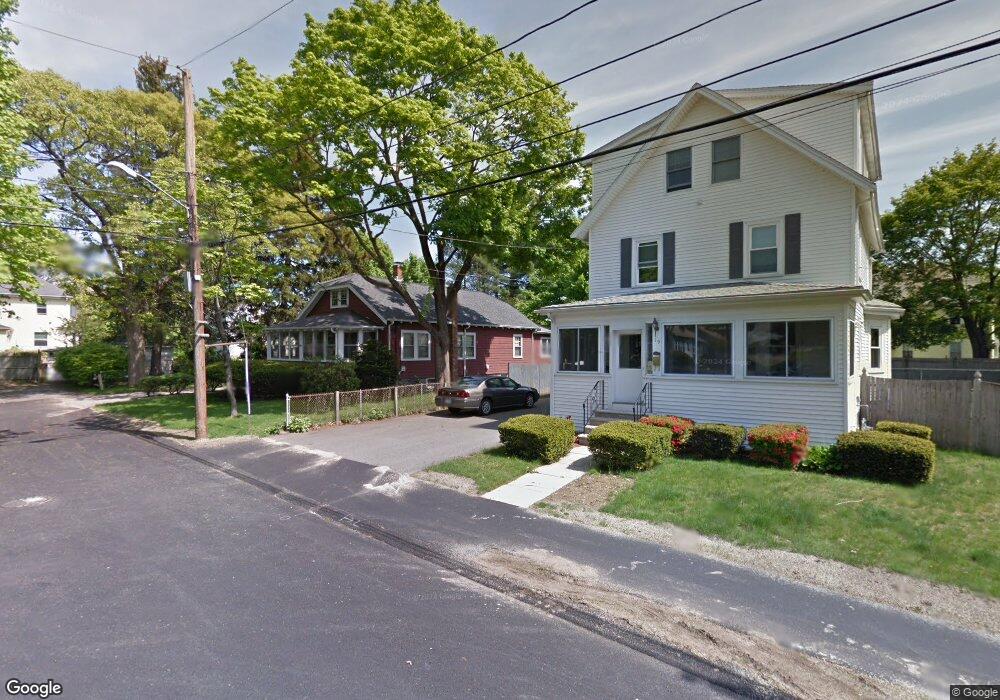
21 Azel Rd Braintree, MA 02184
North Braintree NeighborhoodEstimated Value: $790,000 - $835,000
About This Home
This home is located at 21 Azel Rd, Braintree, MA 02184 and is currently estimated at $807,654, approximately $327 per square foot. 21 Azel Rd is a home located in Norfolk County with nearby schools including Braintree High School, Step Ahead Kindergarten, and Meeting House Montessori School.
Ownership History
We collect this data history from publicly available records. To have your information removed, we recommend requesting removal directly through your county’s website.
Purchase Details
Purchase Details
Home Values in the Area
Average Home Value in this Area
Purchase History
We collect this data history from publicly available records. To have your information removed, we recommend requesting removal directly through your county’s website.
| Date | Buyer | Sale Price | Title Company |
|---|---|---|---|
| -- | -- | ||
| $87,900 | -- |
Mortgage History
We collect this data history from publicly available records. To have your information removed, we recommend requesting removal directly through your county’s website.
| Date | Status | Borrower | Loan Amount |
|---|---|---|---|
| Previous Owner | $170,000 | ||
| Previous Owner | $90,000 |
Tax History
We collect this data history from publicly available records. To have your information removed, we recommend requesting removal directly through your county’s website.
| Year | Tax Paid | Tax Assessment Tax Assessment Total Assessment is a certain percentage of the fair market value that is determined by local assessors to be the total taxable value of land and additions on the property. | Land | Improvement |
|---|---|---|---|---|
| 2025 | $5,875 | $588,700 | $339,700 | $249,000 |
| 2024 | $5,338 | $563,100 | $316,800 | $246,300 |
| 2023 | $5,102 | $522,700 | $284,600 | $238,100 |
| 2022 | $4,927 | $495,200 | $257,100 | $238,100 |
| 2021 | $4,353 | $437,500 | $232,300 | $205,200 |
| 2020 | $4,024 | $408,100 | $211,200 | $196,900 |
| 2019 | $3,773 | $373,900 | $202,000 | $171,900 |
| 2018 | $3,678 | $349,000 | $183,600 | $165,400 |
| 2017 | $3,649 | $339,800 | $174,400 | $165,400 |
| 2016 | $3,312 | $301,600 | $146,900 | $154,700 |
| 2015 | $3,255 | $294,000 | $145,100 | $148,900 |
| 2014 | $3,210 | $281,100 | $132,200 | $148,900 |
Map
- 55 Franklin St
- 55 Hobart Ave
- 6 Franklin St
- 78 French Ave
- 80 Hollingsworth Ave
- 11 Royal Lake Dr Unit 6
- 8 Myrtle Ave
- 14 Royal Lake Dr Unit 1
- 12 Royal Lake Dr Unit 8
- 98 West St
- 801 Granite St
- 47 Judson St
- 56 Plain St
- 62 Fountain St
- 414 John Mahar Hwy Unit 209
- 414 John Mahar Hwy Unit 303
- 418 John Mahar Hwy Unit 108
- 49 Cochato Rd
- 78 Windemere Cir
- 9 Oregon Ave
Ask me questions while you tour the home.