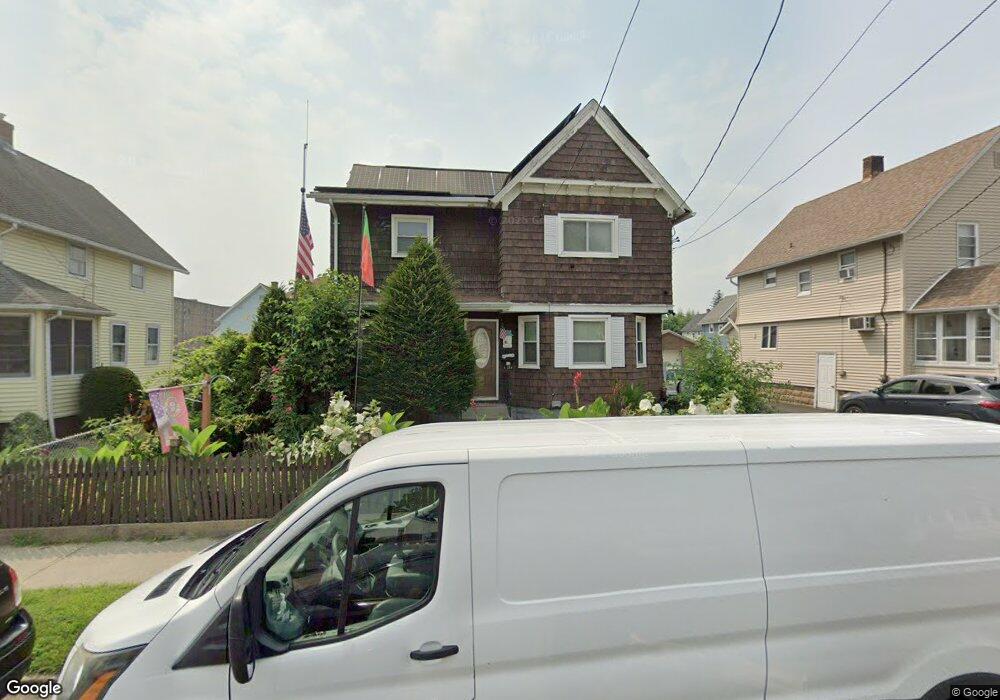
21 Bristol St Ludlow, MA 01056
Estimated Value: $285,000 - $323,000
3
Beds
2
Baths
1,694
Sq Ft
$179/Sq Ft
Est. Value
About This Home
This home is located at 21 Bristol St, Ludlow, MA 01056 and is currently estimated at $303,961, approximately $179 per square foot. 21 Bristol St is a home located in Hampden County with nearby schools including East Street Elementary School, Chapin Street Elementary School, and Paul R. Baird Middle School.
Ownership History
Date
Name
Owned For
Owner Type
Purchase Details
Closed on
May 4, 2021
Sold by
Soares Fernando F and Soares Maria A
Bought by
Soares Daniel F and Soares Mario F
Current Estimated Value
Purchase Details
Closed on
Mar 26, 1981
Bought by
Soares Fernando F and Soares Maria A
Create a Home Valuation Report for This Property
The Home Valuation Report is an in-depth analysis detailing your home's value as well as a comparison with similar homes in the area
Home Values in the Area
Average Home Value in this Area
Purchase History
| Date | Buyer | Sale Price | Title Company |
|---|---|---|---|
| Soares Daniel F | -- | None Available | |
| Soares Daniel F | -- | None Available | |
| Soares Fernando F | $38,000 | -- |
Source: Public Records
Mortgage History
| Date | Status | Borrower | Loan Amount |
|---|---|---|---|
| Previous Owner | Soares Fernando F | $80,500 | |
| Previous Owner | Soares Fernando F | $70,000 | |
| Previous Owner | Soares Fernando F | $62,500 |
Source: Public Records
Tax History
| Year | Tax Paid | Tax Assessment Tax Assessment Total Assessment is a certain percentage of the fair market value that is determined by local assessors to be the total taxable value of land and additions on the property. | Land | Improvement |
|---|---|---|---|---|
| 2025 | $4,072 | $234,700 | $70,400 | $164,300 |
| 2024 | $3,924 | $216,900 | $70,400 | $146,500 |
| 2023 | $3,744 | $191,900 | $61,800 | $130,100 |
| 2022 | $3,574 | $178,800 | $61,800 | $117,000 |
| 2021 | $3,590 | $170,300 | $61,800 | $108,500 |
| 2020 | $3,439 | $166,800 | $60,800 | $106,000 |
| 2019 | $3,229 | $162,900 | $60,200 | $102,700 |
| 2018 | $3,028 | $159,300 | $60,200 | $99,100 |
| 2017 | $2,902 | $156,600 | $58,500 | $98,100 |
| 2016 | $2,756 | $152,000 | $57,300 | $94,700 |
| 2015 | $2,583 | $149,400 | $56,700 | $92,700 |
Source: Public Records
Map
Nearby Homes
- 37 Franklin St
- 59 Prospect St
- 31 Greenwich St
- 63 Oak St
- 162 Highland Ave
- 0 Center St Unit 73415933
- 12 Weston St
- 24 Dumaine St
- 107 Enfield St
- 144 Stony Hill Rd
- 259 Prospect St
- 39 Rogers Ave
- 2205 Boston Rd Unit Q160
- 2205 Boston Rd Unit K100
- 350 West Ave Unit 5
- 54 Dudley St
- 24 Lodge Ln Unit 24
- 32 Kent Rd
- 191 Laconia St
- 46-48 Milton St
- 25 Bristol St
- 15 Bristol St
- 20 Hampshire St
- 31 Bristol St
- 24 Hampshire St
- 11 Bristol St
- 16 Hampshire St
- 32 Hampshire St
- 22 Bristol St
- 10 Hampshire St
- 37 Bristol St
- 26 Bristol St
- 12 Bristol St
- 36 Hampshire St
- 41 Bristol St
- 38 Bristol St
- 42 Hampshire St
- 21 Hampshire St
- 21 Duke St
- 25 Hampshire St Unit 27
Your Personal Tour Guide
Ask me questions while you tour the home.