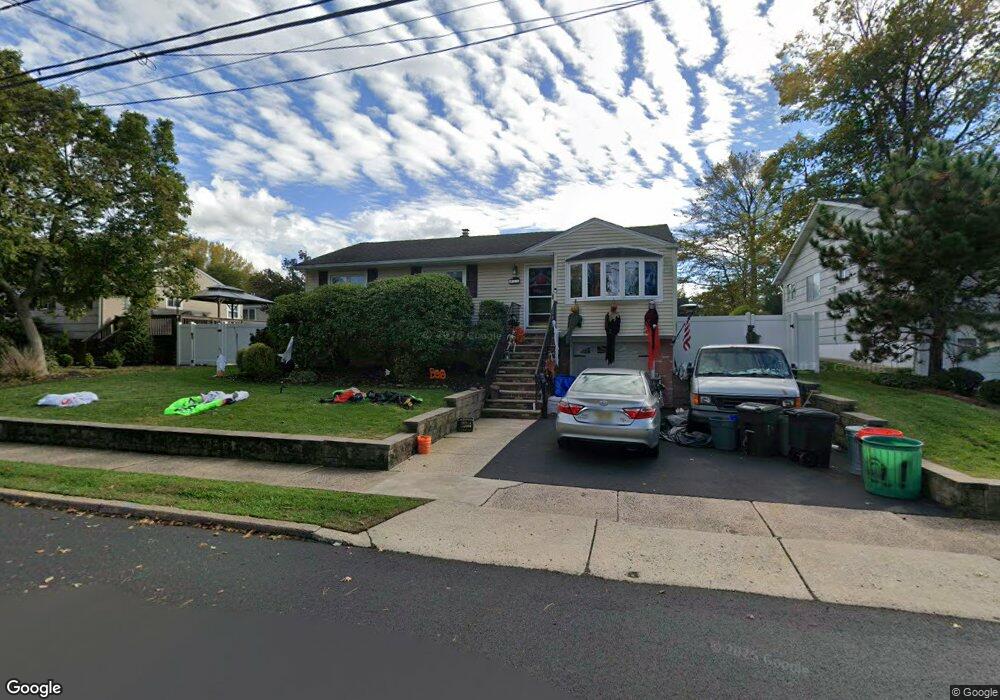
21 Cedar Rd Dumont, NJ 07628
Estimated Value: $574,747 - $632,000
About This Home
This home is located at 21 Cedar Rd, Dumont, NJ 07628 and is currently estimated at $611,937, approximately $549 per square foot. 21 Cedar Rd is a home located in Bergen County with nearby schools including Dumont High School and Institute For Educational Achievement.
Ownership History
We collect this data history from publicly available records. To have your information removed, we recommend requesting removal directly through your county’s website.
Purchase Details
Home Financials for this Owner
Home Financials are based on the most recent Mortgage that was taken out on this home.Purchase Details
Home Financials for this Owner
Home Financials are based on the most recent Mortgage that was taken out on this home.Home Values in the Area
Average Home Value in this Area
Purchase History
We collect this data history from publicly available records. To have your information removed, we recommend requesting removal directly through your county’s website.
| Date | Buyer | Sale Price | Title Company |
|---|---|---|---|
| $183,000 | -- | ||
| $107,500 | -- |
Mortgage History
We collect this data history from publicly available records. To have your information removed, we recommend requesting removal directly through your county’s website.
| Date | Status | Borrower | Loan Amount |
|---|---|---|---|
| Open | $168,570 |
Tax History
We collect this data history from publicly available records. To have your information removed, we recommend requesting removal directly through your county’s website.
| Year | Tax Paid | Tax Assessment Tax Assessment Total Assessment is a certain percentage of the fair market value that is determined by local assessors to be the total taxable value of land and additions on the property. | Land | Improvement |
|---|---|---|---|---|
| 2025 | $11,524 | $521,100 | $335,100 | $186,000 |
| 2024 | $11,241 | $283,500 | $190,200 | $93,300 |
| 2023 | $11,008 | $283,500 | $190,200 | $93,300 |
| 2022 | $11,008 | $283,500 | $190,200 | $93,300 |
| 2021 | $10,954 | $283,500 | $190,200 | $93,300 |
| 2020 | $10,657 | $283,500 | $190,200 | $93,300 |
| 2019 | $10,402 | $283,500 | $190,200 | $93,300 |
| 2018 | $10,189 | $283,500 | $190,200 | $93,300 |
| 2017 | $9,993 | $283,500 | $190,200 | $93,300 |
| 2016 | $9,761 | $283,500 | $190,200 | $93,300 |
| 2015 | $9,537 | $283,500 | $190,200 | $93,300 |
| 2014 | $9,350 | $283,500 | $190,200 | $93,300 |
Map
- 26 Wareham Rd
- 30 Brookfield Rd
- 63 Cypress Rd
- 455 Sunset Ave
- 87 Barbara Rd
- 8 Huntting Dr
- 55 Huntting Dr
- 592 Fermery Dr
- 525 Washington Ave
- 620 Fermery Dr
- 67 Central Ave
- 112 Oxford Place
- 15 Congress St
- 627 Concord St
- 144 New Milford Ave
- 101 Larch Ave
- 135 Cresskill Ave
- 120 Larch Ave
- 226 Haworth Ave
- 349 Trensch Dr
Ask me questions while you tour the home.