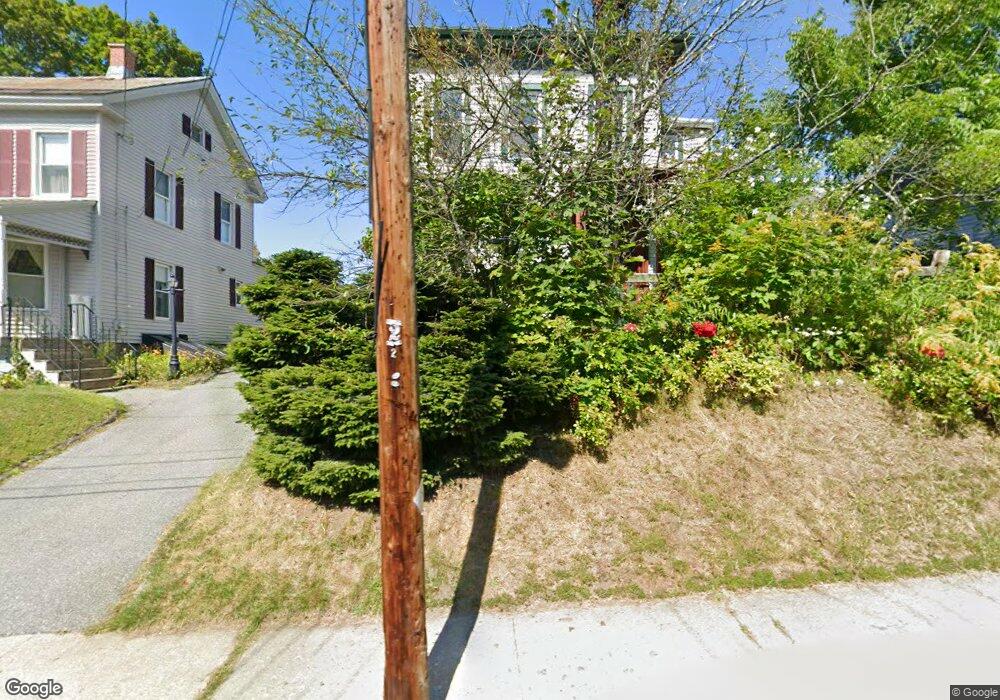
21 Cherry St North Adams, MA 01247
Estimated Value: $349,000 - $503,000
5
Beds
3
Baths
2,692
Sq Ft
$151/Sq Ft
Est. Value
About This Home
This home is located at 21 Cherry St, North Adams, MA 01247 and is currently estimated at $406,915, approximately $151 per square foot. 21 Cherry St is a home located in Berkshire County with nearby schools including Colegrove Park Elementary School and Drury High School.
Ownership History
Date
Name
Owned For
Owner Type
Purchase Details
Closed on
Mar 3, 2011
Sold by
Rai Ashok and Gutschow Kim
Bought by
Dubow Berger K and Dubow Saral
Current Estimated Value
Purchase Details
Closed on
May 2, 2003
Sold by
Bowen Brooks and Bowen Lorraine A
Bought by
Rai Ashok and Gutschow Kim
Purchase Details
Closed on
Apr 27, 2000
Sold by
Goldstein Marc A and Goldstein Marsha L
Bought by
Bowen Brooks and Bowen Lorraine A
Create a Home Valuation Report for This Property
The Home Valuation Report is an in-depth analysis detailing your home's value as well as a comparison with similar homes in the area
Home Values in the Area
Average Home Value in this Area
Purchase History
| Date | Buyer | Sale Price | Title Company |
|---|---|---|---|
| Dubow Berger K | $210,000 | -- | |
| Rai Ashok | $134,000 | -- | |
| Bowen Brooks | $75,000 | -- | |
| Dubow Berger K | $210,000 | -- | |
| Rai Ashok | $134,000 | -- | |
| Bowen Brooks | $75,000 | -- |
Source: Public Records
Mortgage History
| Date | Status | Borrower | Loan Amount |
|---|---|---|---|
| Open | Bowen Brooks | $100,000 | |
| Closed | Bowen Brooks | $98,754 |
Source: Public Records
Tax History
| Year | Tax Paid | Tax Assessment Tax Assessment Total Assessment is a certain percentage of the fair market value that is determined by local assessors to be the total taxable value of land and additions on the property. | Land | Improvement |
|---|---|---|---|---|
| 2025 | $5,533 | $331,100 | $32,900 | $298,200 |
| 2024 | $5,195 | $303,100 | $30,100 | $273,000 |
| 2023 | $5,098 | $288,500 | $30,100 | $258,400 |
| 2022 | $4,547 | $245,400 | $30,100 | $215,300 |
| 2021 | $4,228 | $227,200 | $27,900 | $199,300 |
| 2020 | $4,050 | $217,500 | $27,700 | $189,800 |
| 2019 | $3,843 | $201,100 | $27,700 | $173,400 |
| 2018 | $3,663 | $199,300 | $29,200 | $170,100 |
| 2017 | $3,488 | $197,400 | $28,900 | $168,500 |
| 2016 | $3,375 | $194,100 | $28,900 | $165,200 |
| 2015 | $3,194 | $191,400 | $29,900 | $161,500 |
Source: Public Records
Map
Nearby Homes
- 30 Dover St
- 82 Cherry St
- 84 Washington Ave
- 74 Washington Ave
- 67-69 E Quincy St
- 138 Church St
- 24 Spring St
- 32-38 Spring St
- 0 Church St
- 19 N Church St Unit 5
- 19 N Church St Unit 12
- 19 N Church St Unit 10
- 35 Jackson St
- 131 State St
- 17-19 Bracewell Ave
- 306 Union St
- 222 Eagle St
- 23 Murray Ave
- 33-35 Hall St
- 27 Hall St
Your Personal Tour Guide
Ask me questions while you tour the home.