Estimated Value: $67,894 - $102,000
3
Beds
2
Baths
1,058
Sq Ft
$84/Sq Ft
Est. Value
About This Home
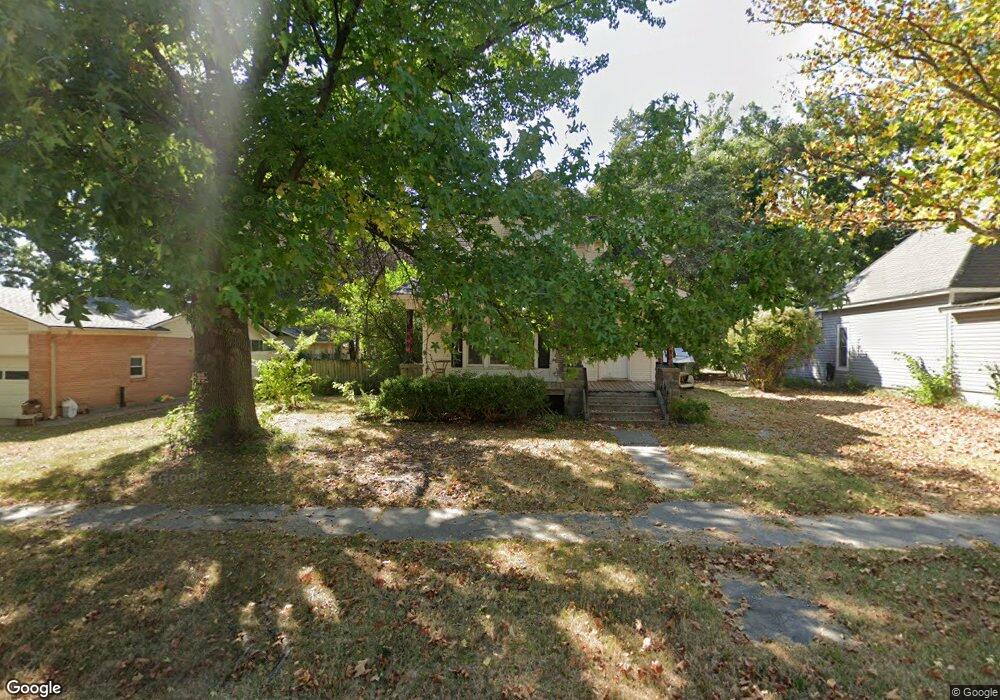
This home is located at 21 D St NW, Miami, OK 74354 and is currently estimated at $88,474, approximately $83 per square foot. 21 D St NW is a home located in Ottawa County with nearby schools including Miami High School and Mt Olive Lutheran School.
Ownership History
Date
Name
Owned For
Owner Type
Purchase Details
Closed on
Jun 9, 2025
Sold by
Ottawa County
Bought by
Gonzales Catherine
Current Estimated Value
Purchase Details
Closed on
Mar 11, 2021
Sold by
Horton Sherry Darlene
Bought by
The First National Bk & Tr Co Of Mi
Purchase Details
Closed on
Oct 19, 2020
Sold by
Sharp Dewayne Allen and Bryant Susan
Bought by
The First National Bk & Tr Co Of Miami
Purchase Details
Closed on
Mar 3, 2004
Bought by
Sharp Dewayne Allen
Create a Home Valuation Report for This Property
The Home Valuation Report is an in-depth analysis detailing your home's value as well as a comparison with similar homes in the area
Purchase History
We collect this data history from publicly available records. To have your information removed, we recommend requesting removal directly through your county’s website.
| Date | Buyer | Sale Price | Title Company |
|---|---|---|---|
| Gonzales Catherine | $7,000 | None Listed On Document | |
| Gonzales Catherine | $7,000 | None Listed On Document | |
| The First National Bk & Tr Co Of Mi | -- | None Available | |
| The First National Bk & Tr Co Of Miami | -- | None Available | |
| Sharp Dewayne Allen | $45,000 | -- |
Source: Public Records
Tax History
| Year | Tax Paid | Tax Assessment Tax Assessment Total Assessment is a certain percentage of the fair market value that is determined by local assessors to be the total taxable value of land and additions on the property. | Land | Improvement |
|---|---|---|---|---|
| 2025 | $685 | $7,110 | $627 | $6,483 |
| 2024 | $785 | $8,146 | $627 | $7,519 |
| 2023 | $785 | $8,103 | $627 | $7,476 |
| 2022 | $749 | $8,103 | $627 | $7,476 |
| 2021 | $766 | $8,103 | $627 | $7,476 |
| 2020 | $524 | $5,498 | $627 | $4,871 |
| 2019 | $348 | $5,236 | $627 | $4,609 |
| 2018 | $350 | $5,236 | $627 | $4,609 |
| 2017 | $356 | $5,236 | $627 | $4,609 |
| 2016 | $363 | $5,516 | $627 | $4,889 |
| 2015 | $456 | $5,130 | $310 | $4,820 |
| 2014 | $419 | $6,116 | $584 | $5,532 |
Source: Public Records
Map
Nearby Homes
Your Personal Tour Guide
Ask me questions while you tour the home.