21 E Main St Stony Point, NY 10980
Estimated Value: $477,000 - $523,000
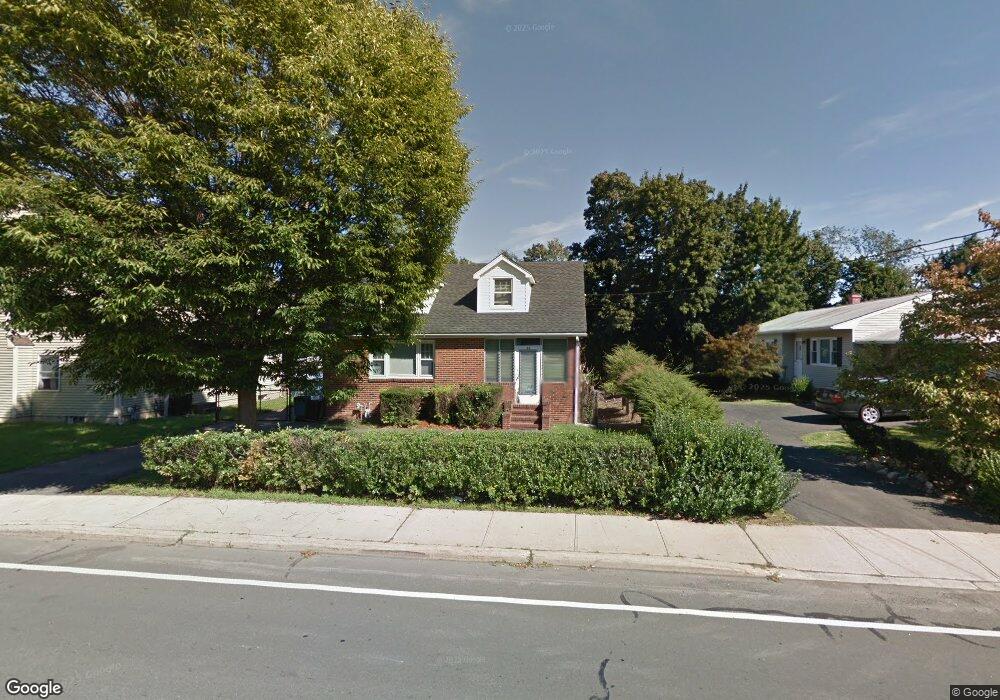
About This Home
This home is located at 21 E Main St, Stony Point, NY 10980 and is currently estimated at $495,507, approximately $345 per square foot. 21 E Main St is a home located in Rockland County with nearby schools including James A. Farley Middle School, Stony Point Elementary School, and Fieldstone Secondary School.
Ownership History
We collect this data history from publicly available records. To have your information removed, we recommend requesting removal directly through your county’s website.
Purchase Details
Purchase Details
Home Financials for this Owner
Home Financials are based on the most recent Mortgage that was taken out on this home.Home Values in the Area
Average Home Value in this Area
Purchase History
We collect this data history from publicly available records. To have your information removed, we recommend requesting removal directly through your county’s website.
| Date | Buyer | Sale Price | Title Company |
|---|---|---|---|
| -- | -- | ||
| $165,000 | Chicago Title Insurance Co |
Mortgage History
We collect this data history from publicly available records. To have your information removed, we recommend requesting removal directly through your county’s website.
| Date | Status | Borrower | Loan Amount |
|---|---|---|---|
| Open | $132,000 | ||
| Closed | $13,000 |
Tax History
We collect this data history from publicly available records. To have your information removed, we recommend requesting removal directly through your county’s website.
| Year | Tax Paid | Tax Assessment Tax Assessment Total Assessment is a certain percentage of the fair market value that is determined by local assessors to be the total taxable value of land and additions on the property. | Land | Improvement |
|---|---|---|---|---|
| 2024 | $11,285 | $31,700 | $4,100 | $27,600 |
| 2023 | $11,285 | $31,700 | $4,100 | $27,600 |
| 2022 | $2,913 | $31,700 | $4,100 | $27,600 |
| 2021 | $2,913 | $31,700 | $4,100 | $27,600 |
| 2020 | $7,315 | $31,700 | $4,100 | $27,600 |
| 2019 | $2,571 | $31,700 | $4,100 | $27,600 |
| 2018 | $6,945 | $31,700 | $4,100 | $27,600 |
| 2017 | $6,790 | $31,700 | $4,100 | $27,600 |
| 2016 | $7,028 | $31,700 | $4,100 | $27,600 |
| 2015 | -- | $31,700 | $4,100 | $27,600 |
| 2014 | -- | $31,700 | $4,100 | $27,600 |
Map
- 74 Beach Rd
- 24 Leeward Ln
- 61 E Main St
- 11 Windward Way
- 12 Ba Mar Dr
- 73 Tomkins Ave
- 34 Windward Way
- 32 Ba Mar Dr
- 33 Nordica Cir
- 14 Hoover Place
- 36 N Liberty Dr
- 7 Highview Ave
- 27 Hunter Place
- 29 Hoover Place
- 8 Wenzel Ln
- 12 Bayview Dr
- 30 Govan Dr
- 3 Mountain View Mobile Home Park
- 81 Jay St
- 46 Franklin Dr
Ask me questions while you tour the home.