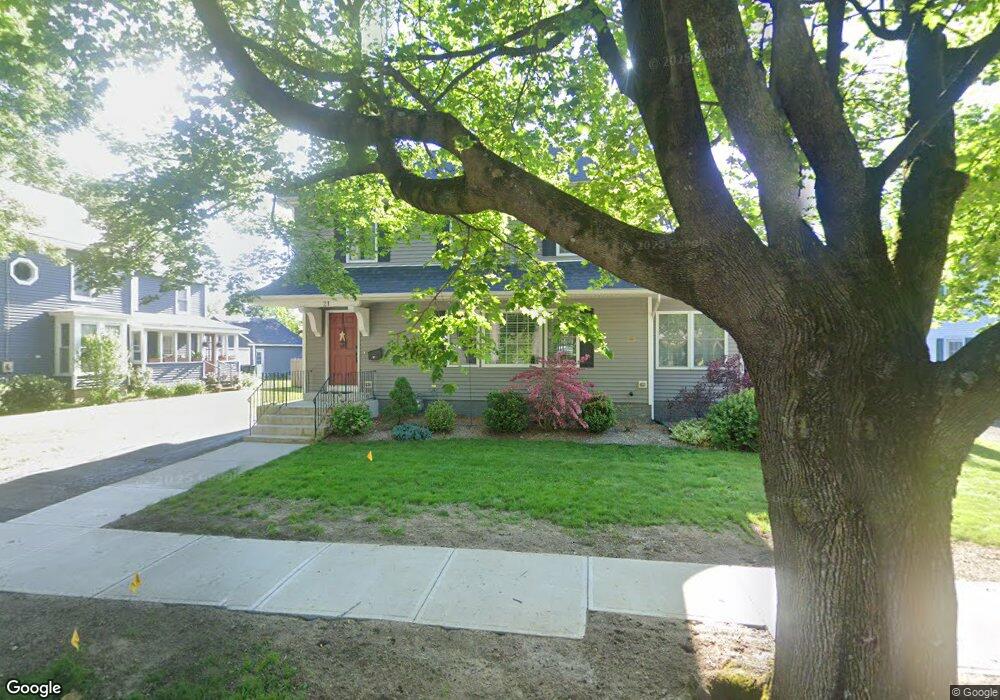
21 High St Westfield, MA 01085
Estimated Value: $320,000 - $375,000
4
Beds
2
Baths
2,288
Sq Ft
$156/Sq Ft
Est. Value
About This Home
This home is located at 21 High St, Westfield, MA 01085 and is currently estimated at $356,969, approximately $156 per square foot. 21 High St is a home located in Hampden County with nearby schools including Westfield High School and Saint Mary High School.
Ownership History
Date
Name
Owned For
Owner Type
Purchase Details
Closed on
Oct 29, 2004
Sold by
Sico Joseph and Leonard Pamela
Bought by
Moore Daniel P and Moore Jodie A
Current Estimated Value
Home Financials for this Owner
Home Financials are based on the most recent Mortgage that was taken out on this home.
Original Mortgage
$143,200
Outstanding Balance
$71,271
Interest Rate
5.74%
Mortgage Type
Purchase Money Mortgage
Estimated Equity
$285,698
Create a Home Valuation Report for This Property
The Home Valuation Report is an in-depth analysis detailing your home's value as well as a comparison with similar homes in the area
Home Values in the Area
Average Home Value in this Area
Purchase History
| Date | Buyer | Sale Price | Title Company |
|---|---|---|---|
| Moore Daniel P | $179,000 | -- |
Source: Public Records
Mortgage History
| Date | Status | Borrower | Loan Amount |
|---|---|---|---|
| Open | Moore Daniel P | $143,200 | |
| Closed | Moore Daniel P | $17,700 |
Source: Public Records
Tax History
| Year | Tax Paid | Tax Assessment Tax Assessment Total Assessment is a certain percentage of the fair market value that is determined by local assessors to be the total taxable value of land and additions on the property. | Land | Improvement |
|---|---|---|---|---|
| 2025 | $4,493 | $296,000 | $97,800 | $198,200 |
| 2024 | $4,329 | $271,100 | $88,900 | $182,200 |
| 2023 | $4,157 | $244,800 | $84,700 | $160,100 |
| 2022 | $3,975 | $215,000 | $75,600 | $139,400 |
| 2021 | $3,825 | $202,600 | $71,300 | $131,300 |
| 2020 | $3,752 | $192,600 | $71,300 | $121,300 |
| 2019 | $3,709 | $183,300 | $68,000 | $115,300 |
| 2018 | $3,627 | $183,300 | $68,000 | $115,300 |
| 2017 | $3,498 | $180,100 | $68,900 | $111,200 |
| 2016 | $3,501 | $180,100 | $68,900 | $111,200 |
| 2015 | $3,339 | $180,100 | $68,900 | $111,200 |
| 2014 | $2,496 | $180,100 | $68,900 | $111,200 |
Source: Public Records
Map
Nearby Homes
- 32 Allen Ave
- 42R Jefferson St
- 7 Washington St
- 26 Hayre St
- 19 Kellogg St
- 70 S Maple St
- 4 Belmont St
- 16 Squawfield Rd
- 3 Belmont St
- 74 S Maple St
- 42 Putnam Dr
- 97 Mechanic St
- 100 Meadow St
- Lot 5 Montgomery
- 9 Montgomery St
- 324 Russell Rd Unit 204
- 324 Russell Rd Unit 109
- 324 Russell Rd Unit 101
- 44 Kensington Ave
- 13 Furrow St
Your Personal Tour Guide
Ask me questions while you tour the home.