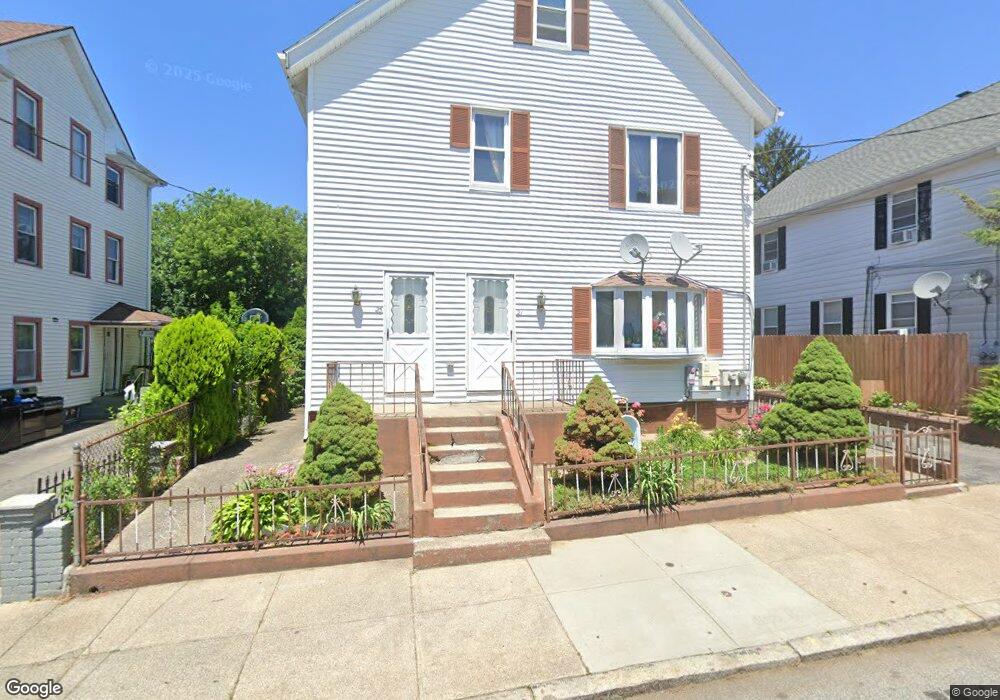
21 Ivy St Pawtucket, RI 02860
Estimated Value: $517,560 - $635,000
6
Beds
2
Baths
2,800
Sq Ft
$209/Sq Ft
Est. Value
About This Home
This home is located at 21 Ivy St, Pawtucket, RI 02860 and is currently estimated at $586,390, approximately $209 per square foot. 21 Ivy St is a home located in Providence County with nearby schools including Blackstone Valley Prep Junior High School.
Ownership History
Date
Name
Owned For
Owner Type
Purchase Details
Closed on
Jul 2, 2002
Sold by
Costa Fernando M and Costa Maria C
Bought by
Majkut Boguslaw and Majkut Halina
Current Estimated Value
Home Financials for this Owner
Home Financials are based on the most recent Mortgage that was taken out on this home.
Original Mortgage
$171,000
Interest Rate
6.92%
Create a Home Valuation Report for This Property
The Home Valuation Report is an in-depth analysis detailing your home's value as well as a comparison with similar homes in the area
Home Values in the Area
Average Home Value in this Area
Purchase History
| Date | Buyer | Sale Price | Title Company |
|---|---|---|---|
| Majkut Boguslaw | $180,000 | -- |
Source: Public Records
Mortgage History
| Date | Status | Borrower | Loan Amount |
|---|---|---|---|
| Open | Majkut Boguslaw | $248,000 | |
| Closed | Majkut Boguslaw | $243,000 | |
| Closed | Majkut Boguslaw | $25,000 | |
| Closed | Majkut Boguslaw | $171,000 |
Source: Public Records
Tax History
| Year | Tax Paid | Tax Assessment Tax Assessment Total Assessment is a certain percentage of the fair market value that is determined by local assessors to be the total taxable value of land and additions on the property. | Land | Improvement |
|---|---|---|---|---|
| 2025 | $6,163 | $468,700 | $118,300 | $350,400 |
| 2024 | $5,784 | $468,700 | $118,300 | $350,400 |
| 2023 | $5,243 | $309,500 | $53,200 | $256,300 |
| 2022 | $5,132 | $309,500 | $53,200 | $256,300 |
| 2021 | $5,132 | $309,500 | $53,200 | $256,300 |
| 2020 | $4,880 | $233,600 | $53,900 | $179,700 |
| 2019 | $4,880 | $233,600 | $53,900 | $179,700 |
| 2018 | $4,702 | $233,600 | $53,900 | $179,700 |
| 2017 | $4,244 | $186,800 | $41,000 | $145,800 |
| 2016 | $4,089 | $186,800 | $41,000 | $145,800 |
| 2015 | $4,089 | $186,800 | $41,000 | $145,800 |
| 2014 | $4,315 | $187,100 | $52,700 | $134,400 |
Source: Public Records
Map
Nearby Homes
- 546 Lonsdale Ave Unit 548
- 17 Beecher St
- 616 Lonsdale Ave Unit 618
- 75 Baldwin St
- 14 Martin Ct
- 584 Weeden St
- 48 Star St
- 722 Dexter St Unit 726
- 128 Summer St Unit 130
- 457 Mineral Spring Ave
- 60 Hendricks St
- 193 Harrison St
- 108 Sumner Ave
- 106 Sumner Ave
- 76 Slater St
- 85 Hendricks St
- 872 Lonsdale Ave
- 35 Rand St
- 140 Dexter St
- 88 Bagley St
Your Personal Tour Guide
Ask me questions while you tour the home.