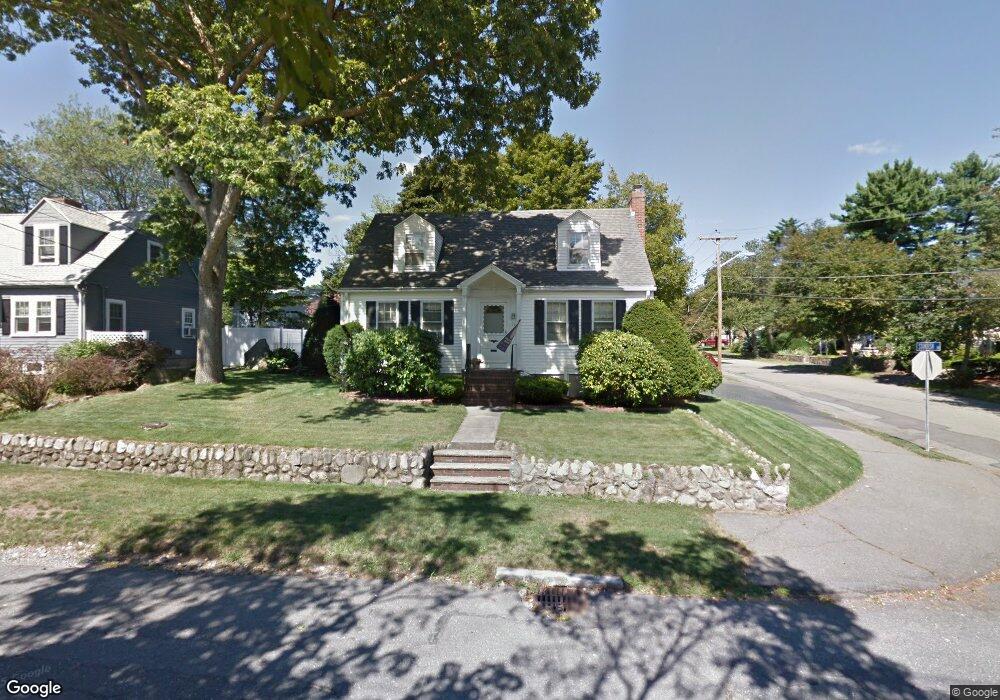
21 Lansing Rd Lynn, MA 01904
Lynn Woods NeighborhoodEstimated Value: $596,845 - $711,000
About This Home
This home is located at 21 Lansing Rd, Lynn, MA 01904 and is currently estimated at $642,711, approximately $416 per square foot. 21 Lansing Rd is a home located in Essex County with nearby schools including Capt. William G. Shoemaker Elementary School, William R. Fallon School, and Pickering Middle School.
Ownership History
We collect this data history from publicly available records. To have your information removed, we recommend requesting removal directly through your county’s website.
Purchase Details
Purchase Details
Home Values in the Area
Average Home Value in this Area
Purchase History
We collect this data history from publicly available records. To have your information removed, we recommend requesting removal directly through your county’s website.
| Date | Buyer | Sale Price | Title Company |
|---|---|---|---|
| -- | -- | ||
| -- | -- | ||
| -- | -- | ||
| $46,000 | -- |
Mortgage History
We collect this data history from publicly available records. To have your information removed, we recommend requesting removal directly through your county’s website.
| Date | Status | Borrower | Loan Amount |
|---|---|---|---|
| Previous Owner | $40,000 | ||
| Previous Owner | $68,000 | ||
| Previous Owner | $45,000 | ||
| Previous Owner | $38,000 |
Tax History
We collect this data history from publicly available records. To have your information removed, we recommend requesting removal directly through your county’s website.
| Year | Tax Paid | Tax Assessment Tax Assessment Total Assessment is a certain percentage of the fair market value that is determined by local assessors to be the total taxable value of land and additions on the property. | Land | Improvement |
|---|---|---|---|---|
| 2025 | $5,782 | $558,100 | $214,700 | $343,400 |
| 2024 | $5,506 | $522,900 | $205,900 | $317,000 |
| 2023 | $5,670 | $508,500 | $229,200 | $279,300 |
| 2022 | $5,291 | $425,700 | $166,100 | $259,600 |
| 2021 | $5,010 | $384,500 | $160,000 | $224,500 |
| 2020 | $4,866 | $363,100 | $151,100 | $212,000 |
| 2019 | $4,709 | $329,300 | $127,300 | $202,000 |
| 2018 | $4,960 | $327,400 | $153,000 | $174,400 |
| 2017 | $4,756 | $304,900 | $142,700 | $162,200 |
| 2016 | $4,626 | $285,900 | $132,900 | $153,000 |
| 2015 | $4,479 | $267,400 | $131,500 | $135,900 |
Map
- 714 Lynnfield St
- 12 Regina Rd
- 57 Cumberland Cir
- 630 Lynnfield St
- 463 Cedar Brook Rd
- 53 Longhill Rd
- 94 Judge Rd
- 31 Emerald Dr
- 922 Lynnfield St
- 367 Lynnfield St
- 7 Nathans Way
- 4 Will Sawyer St
- 60r Lynnbrook Rd
- 12 Mansfield St
- 6 Wright St
- 34 Dona Rd
- 1100 Salem St Unit 79
- 1100 Salem St Unit 75
- 5 Otter Pond Rd
- 4 Rossmore Rd
- 19 Stonewood Ln
- 20 Standish Rd
- 11 Stonewood Ln
- 25 Stonewood Ln
- 12 Standish Rd
- 26 Standish Rd
- 22 Stonewood Ln
- 33 Stonewood Ln
- 39 Lansing Rd
- 25 Lansing Rd
- 32 Standish Rd
- 45 Lansing Rd
- 51 Lansing Rd
- 19 Standish Rd
- 7 Standish Rd
- 25 Standish Rd
- 34 Stonewood Ln
- 39 Stonewood Ln
- 38 Standish Rd
- 55 Lansing Rd
Ask me questions while you tour the home.