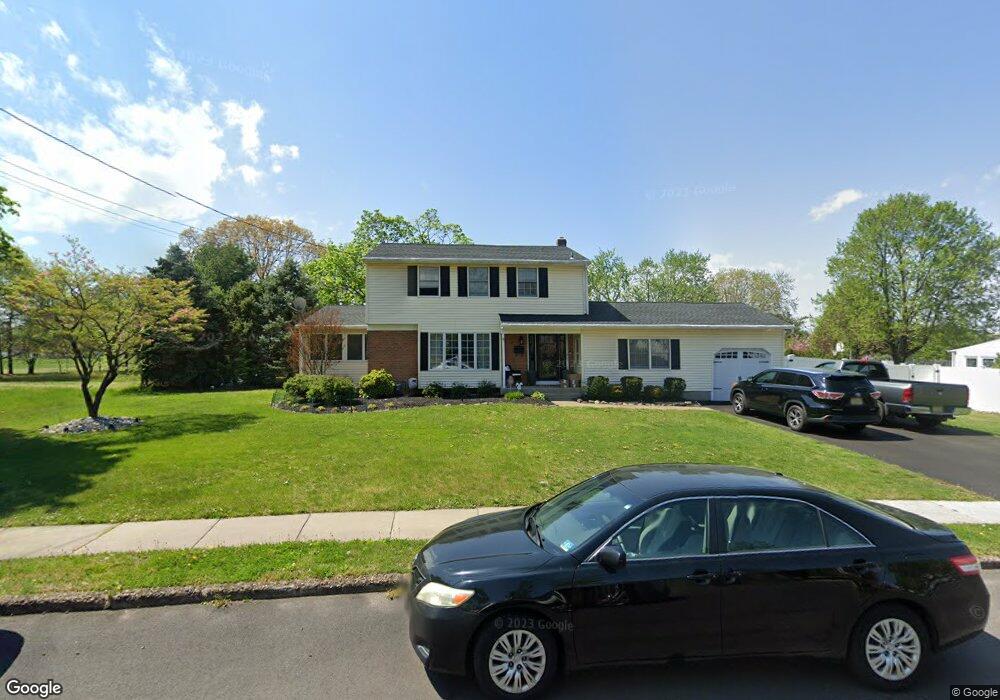
21 Montclair Dr Delran, NJ 08075
Estimated Value: $518,000 - $610,000
About This Home
This home is located at 21 Montclair Dr, Delran, NJ 08075 and is currently estimated at $563,666, approximately $272 per square foot. 21 Montclair Dr is a home located in Burlington County with nearby schools including Millbridge Elementary School, Delran Intermediate School, and Delran Middle School.
Ownership History
We collect this data history from publicly available records. To have your information removed, we recommend requesting removal directly through your county’s website.
Purchase Details
Purchase Details
Home Financials for this Owner
Home Financials are based on the most recent Mortgage that was taken out on this home.Purchase Details
Home Values in the Area
Average Home Value in this Area
Purchase History
We collect this data history from publicly available records. To have your information removed, we recommend requesting removal directly through your county’s website.
| Date | Buyer | Sale Price | Title Company |
|---|---|---|---|
| -- | None Available | ||
| $327,500 | Old Republic National Title | ||
| -- | -- |
Mortgage History
We collect this data history from publicly available records. To have your information removed, we recommend requesting removal directly through your county’s website.
| Date | Status | Borrower | Loan Amount |
|---|---|---|---|
| Previous Owner | $262,000 |
Tax History
We collect this data history from publicly available records. To have your information removed, we recommend requesting removal directly through your county’s website.
| Year | Tax Paid | Tax Assessment Tax Assessment Total Assessment is a certain percentage of the fair market value that is determined by local assessors to be the total taxable value of land and additions on the property. | Land | Improvement |
|---|---|---|---|---|
| 2025 | $9,483 | $250,100 | $67,100 | $183,000 |
| 2024 | $9,397 | $238,500 | $67,100 | $171,400 |
| 2023 | $9,397 | $238,500 | $67,100 | $171,400 |
| 2022 | $9,275 | $238,500 | $67,100 | $171,400 |
| 2021 | $9,280 | $238,500 | $67,100 | $171,400 |
| 2020 | $9,261 | $238,500 | $67,100 | $171,400 |
| 2019 | $9,175 | $238,500 | $67,100 | $171,400 |
| 2018 | $9,022 | $238,500 | $67,100 | $171,400 |
| 2017 | $8,879 | $238,500 | $67,100 | $171,400 |
| 2016 | $8,748 | $238,500 | $67,100 | $171,400 |
| 2015 | $8,603 | $238,500 | $67,100 | $171,400 |
| 2014 | $8,228 | $238,500 | $67,100 | $171,400 |
Map
- 14 Montclair Dr
- 407 Oak St
- 712 Cleveland Ave
- 523 Greenwood Ave
- 803 Devon Rd
- 605 8th St
- 802 Devon Rd
- 820 S Chester Ave
- 5 Henry St
- 507 S Fairview St
- 807 Drexel Ave
- 76 Pancoast Blvd
- 100 Grant St
- 208 Hooker St
- 411 Cleveland Ave
- 224 Progress St
- 257 Progress St
- 53 Cranberry Ln
- 280 Progress St
- 510 Brown St
Ask me questions while you tour the home.