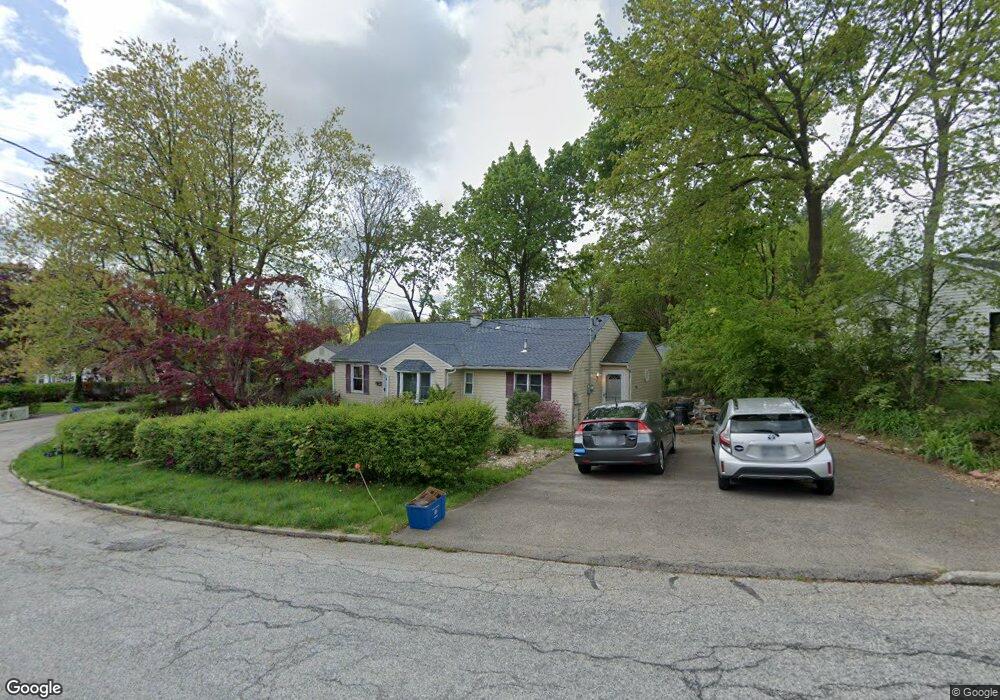
21 Osage Dr E Ossining, NY 10562
Estimated Value: $556,000 - $606,000
About This Home
This home is located at 21 Osage Dr E, Ossining, NY 10562 and is currently estimated at $586,011, approximately $494 per square foot. 21 Osage Dr E is a home located in Westchester County with nearby schools including Park School, Roosevelt Elementary School, and Brookside Elementary School.
Ownership History
We collect this data history from publicly available records. To have your information removed, we recommend requesting removal directly through your county’s website.
Purchase Details
Purchase Details
Home Financials for this Owner
Home Financials are based on the most recent Mortgage that was taken out on this home.Home Values in the Area
Average Home Value in this Area
Purchase History
We collect this data history from publicly available records. To have your information removed, we recommend requesting removal directly through your county’s website.
| Date | Buyer | Sale Price | Title Company |
|---|---|---|---|
| -- | Judicial Title | ||
| $314,500 | -- |
Mortgage History
We collect this data history from publicly available records. To have your information removed, we recommend requesting removal directly through your county’s website.
| Date | Status | Borrower | Loan Amount |
|---|---|---|---|
| Previous Owner | $251,600 |
Tax History
We collect this data history from publicly available records. To have your information removed, we recommend requesting removal directly through your county’s website.
| Year | Tax Paid | Tax Assessment Tax Assessment Total Assessment is a certain percentage of the fair market value that is determined by local assessors to be the total taxable value of land and additions on the property. | Land | Improvement |
|---|---|---|---|---|
| 2025 | $18,890 | $534,800 | $301,200 | $233,600 |
| 2024 | $9,956 | $447,000 | $180,300 | $266,700 |
| 2023 | $11,695 | $414,100 | $180,300 | $233,800 |
| 2022 | $11,306 | $368,100 | $180,300 | $187,800 |
| 2021 | $9,672 | $328,600 | $180,300 | $148,300 |
| 2020 | $11,122 | $328,600 | $180,300 | $148,300 |
| 2019 | $10,824 | $312,000 | $171,800 | $140,200 |
| 2018 | $10,506 | $303,000 | $171,800 | $131,200 |
| 2017 | $5,641 | $300,000 | $171,800 | $128,200 |
| 2016 | $102,419 | $300,000 | $171,800 | $128,200 |
| 2015 | $7,835 | $16,050 | $6,100 | $9,950 |
| 2014 | $7,835 | $17,500 | $6,100 | $11,400 |
| 2013 | $7,835 | $17,500 | $6,100 | $11,400 |
Map
- 53 Pleasantville Rd
- 47 Willow Dr
- 0 Chappaqua Rd
- 10 Stone Ave
- 42 Campwoods Grounds
- 224 Willow Dr
- 159 Chappaqua Rd
- 19 Forest Ave
- 15 Marshall Place
- 31 Orchard Rd
- 16 Sherwood Ave
- 74 Hungerford Rd
- 15 Prospect Ave
- 31 Burns Place
- 128 Croton Ave
- 126 Croton Ave
- 55 Sherwood Ave
- 116 Burns Place
- 41 Clinton Ave
- 18 2nd Ave
Ask me questions while you tour the home.