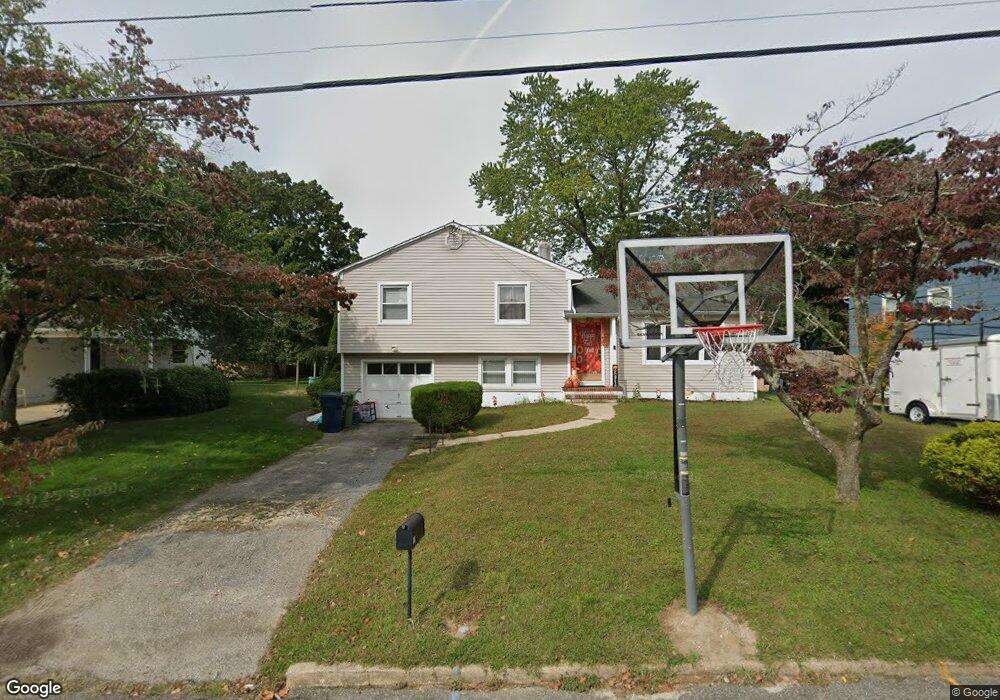
21 Pinebrook Dr Neptune, NJ 07753
Estimated Value: $580,565 - $619,000
3
Beds
1
Bath
1,488
Sq Ft
$399/Sq Ft
Est. Value
About This Home
This home is located at 21 Pinebrook Dr, Neptune, NJ 07753 and is currently estimated at $594,391, approximately $399 per square foot. 21 Pinebrook Dr is a home located in Monmouth County with nearby schools including Neptune High School and Montessori Academy Of New Jersey.
Ownership History
Date
Name
Owned For
Owner Type
Purchase Details
Closed on
Mar 14, 2003
Sold by
Hader David
Bought by
King Richard and Diege Kimberly
Current Estimated Value
Home Financials for this Owner
Home Financials are based on the most recent Mortgage that was taken out on this home.
Original Mortgage
$243,397
Interest Rate
5.82%
Mortgage Type
FHA
Purchase Details
Closed on
Oct 29, 1997
Sold by
Malta Russell
Bought by
Hader David and Hader Christine
Home Financials for this Owner
Home Financials are based on the most recent Mortgage that was taken out on this home.
Original Mortgage
$115,000
Interest Rate
7.23%
Create a Home Valuation Report for This Property
The Home Valuation Report is an in-depth analysis detailing your home's value as well as a comparison with similar homes in the area
Home Values in the Area
Average Home Value in this Area
Purchase History
We collect this data history from publicly available records. To have your information removed, we recommend requesting removal directly through your county’s website.
| Date | Buyer | Sale Price | Title Company |
|---|---|---|---|
| King Richard | $247,000 | -- | |
| Hader David | $134,000 | -- |
Source: Public Records
Mortgage History
We collect this data history from publicly available records. To have your information removed, we recommend requesting removal directly through your county’s website.
| Date | Status | Borrower | Loan Amount |
|---|---|---|---|
| Previous Owner | King Richard | $243,397 | |
| Previous Owner | Hader David | $115,000 |
Source: Public Records
Tax History
| Year | Tax Paid | Tax Assessment Tax Assessment Total Assessment is a certain percentage of the fair market value that is determined by local assessors to be the total taxable value of land and additions on the property. | Land | Improvement |
|---|---|---|---|---|
| 2025 | $7,303 | $516,500 | $287,500 | $229,000 |
| 2024 | $6,975 | $417,100 | $226,400 | $190,700 |
| 2023 | $6,975 | $386,200 | $200,000 | $186,200 |
| 2022 | $7,045 | $353,200 | $170,600 | $182,600 |
| 2021 | $7,059 | $333,400 | $168,600 | $164,800 |
| 2020 | $7,176 | $338,800 | $182,600 | $156,200 |
| 2019 | $7,059 | $329,100 | $182,600 | $146,500 |
| 2018 | $6,395 | $294,700 | $149,300 | $145,400 |
| 2017 | $6,416 | $284,000 | $149,300 | $134,700 |
| 2016 | $6,496 | $286,800 | $154,300 | $132,500 |
| 2015 | $6,316 | $283,600 | $154,300 | $129,300 |
| 2014 | $5,843 | $215,700 | $124,300 | $91,400 |
Source: Public Records
Map
Nearby Homes
- 24 Pinebrook Dr
- 24 Pinebrook Dr
- 27 Schoolhouse Rd
- 25 Pinebrook Dr
- 22 Pinebrook Dr
- 6 Cedarbrook Dr
- 25 Schoolhouse Rd
- 23 Pinebrook Dr
- 8 Cedarbrook Dr
- 7 Cedarbrook Dr
- 20 Pinebrook Dr
- 10 Cedarbrook Dr
- 23 Schoolhouse Rd
- 310 Cliffwood Dr
- 19 Pinebrook Dr
- 26 Jumping Brook Dr
- 311 Cliffwood Dr
- 18 Pinebrook Dr
- 12 Cedarbrook Dr
- 24 Jumping Brook Dr
Your Personal Tour Guide
Ask me questions while you tour the home.